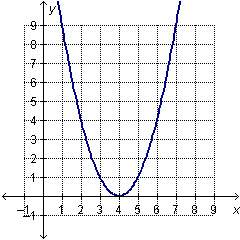
Ramiro drew the graph below.
which equation represents the data in the graph?
y =...

Mathematics, 13.01.2020 17:31 cece3467
Ramiro drew the graph below.
which equation represents the data in the graph?
y =x^2-8x+16
y=5.5x^2-0.5x+4
y=x^2+x+4
y=2.5x^2 - 0.5x+4


Answers: 1


Another question on Mathematics

Mathematics, 21.06.2019 17:00
Ben is three times as old as samantha, who is two years older than half of michel's age. if michel is 12. how old is ben?
Answers: 1

Mathematics, 21.06.2019 19:30
Which describes the difference between the graph of f(x)=x^2 and g(x)=-(x^2-2)
Answers: 1

Mathematics, 21.06.2019 19:30
Factor the polynomial 4x4 – 20x2 – 3x2 + 15 by grouping. what is the resulting expression? (4x2 + 3)(x2 – 5) (4x2 – 3)(x2 – 5) (4x2 – 5)(x2 + 3) (4x2 + 5)(x2 – 3)
Answers: 1

Mathematics, 21.06.2019 20:00
Write the point-slope form of the line passing through (2, -12) and parallel to y=3x.
Answers: 2
You know the right answer?
Questions


Mathematics, 21.10.2020 20:01


Biology, 21.10.2020 20:01


English, 21.10.2020 20:01


Mathematics, 21.10.2020 20:01

Social Studies, 21.10.2020 20:01


Mathematics, 21.10.2020 20:01

Physics, 21.10.2020 20:01

Mathematics, 21.10.2020 20:01


Mathematics, 21.10.2020 20:01


