
Mathematics, 26.07.2019 00:00 maddy6882
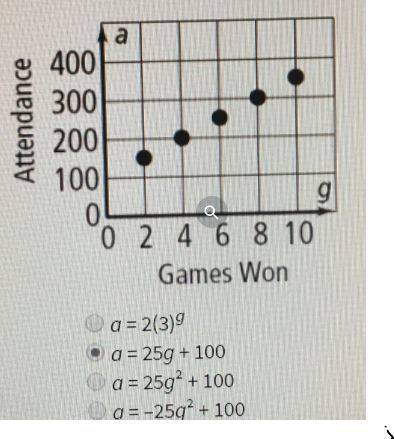
The attendances at the high school basketball games seems to be affected by the success of the team. the graph below models the attendance over the first half of the season. which function would also represent the data shown in the graph below where a represents the attendance and g represents the number of games the team has won? there is a graph with it, but i don't seem to be able to attach it!

Answers: 1


Another question on Mathematics
Mathematics, 21.06.2019 20:00
Describe a situation that you could represent with the inequality x< 17
Answers: 2
Mathematics, 21.06.2019 21:00
Timmy uses 1 1 2 cups of sugar for every 2 gallons of lemonade he makes. how many cups of sugar would timmy use if he makes 13 gallons of lemonade?
Answers: 1
Mathematics, 21.06.2019 21:00
Tim open up a new saving account with a $50 deposit and plant to deposit $20 per week into the same account.write an expression to represent the total amount in his savings account.
Answers: 1
Mathematics, 22.06.2019 00:00
Idon't get undoing if its pass adding and subtracting so can someone ? x-2 over 5 = 18
Answers: 1
You know the right answer?
The attendances at the high school basketball games seems to be affected by the success of the team....
Questions

Health, 08.10.2019 20:40

Business, 08.10.2019 20:40


History, 08.10.2019 20:40

History, 08.10.2019 20:40

Mathematics, 08.10.2019 20:40

Computers and Technology, 08.10.2019 20:50
History, 08.10.2019 20:50

English, 08.10.2019 20:50
Physics, 08.10.2019 20:50
Chemistry, 08.10.2019 20:50


