
Mathematics, 06.10.2019 10:02 juelchasse
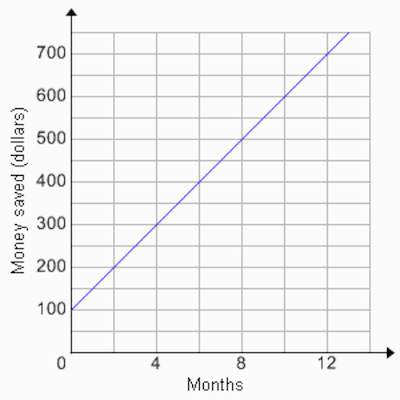
Alex is trying to start a savings plan. the following graph represents his projected savings over the next 12 months. how much money will he have saved by the sixteenth month?
graph with months on the x axis and money saved in dollars on the y axis. graph shows a line hitting points (0, 100), (4, 300), (8, 500), and (12, 700)
$700
$800
$900
$1000

Answers: 1


Another question on Mathematics
Mathematics, 21.06.2019 21:00
Check all that apply. f is a function. f is a one-to-one function. c is a function. c is a one-to-one function.
Answers: 3
Mathematics, 22.06.2019 03:00
An object is accelerating at a constant rate. its velocity in feet per second as a function of time in seconds can be modeled by the linear function v(t) = 2.5t. what does the dependent variable represent for this function? a) acceleration b) distance c) slope d) velocity
Answers: 3
Mathematics, 22.06.2019 03:20
The table shows the height in feet of several students in miss patel’s class
Answers: 1
Mathematics, 22.06.2019 04:40
Complete the frequency table: method of travel to school walk/bike bus car row totals under age 15 60 165 age 15 and above 65 195 column totals 152 110 98 360 what percentage of students under age 15 travel to school by car? round to the nearest whole percent.
Answers: 2
You know the right answer?
Alex is trying to start a savings plan. the following graph represents his projected savings over th...
Questions
Mathematics, 15.04.2021 19:50


Medicine, 15.04.2021 19:50
Mathematics, 15.04.2021 19:50
Mathematics, 15.04.2021 19:50


History, 15.04.2021 19:50
Mathematics, 15.04.2021 19:50
Biology, 15.04.2021 19:50

Social Studies, 15.04.2021 19:50


