Mathematics, 25.07.2019 04:00 rscott400
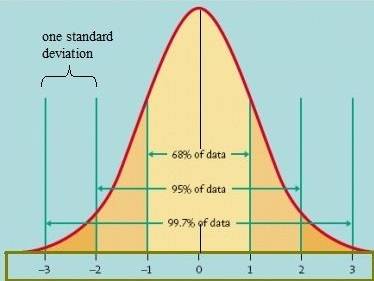
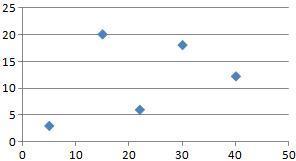
The data represented by the graph is normally distributed and adheres to the 68-95-99.7 rule. the standard deviation of this data is , and % of the data is either less than 4.2 or more than 11.4.

Answers: 1


Another question on Mathematics


Mathematics, 21.06.2019 17:30
Which of the following tables represents exponential functions?
Answers: 1

Mathematics, 21.06.2019 18:40
What value of x is in the solution set of 4x – 12 s 16 + 8x?
Answers: 3

Mathematics, 21.06.2019 18:40
Which compound inequality could be represented by the graph?
Answers: 1
You know the right answer?
The data represented by the graph is normally distributed and adheres to the 68-95-99.7 rule. the st...
Questions

Arts, 03.05.2020 13:41


History, 03.05.2020 13:41


English, 03.05.2020 13:41

Social Studies, 03.05.2020 13:41

Mathematics, 03.05.2020 13:41

English, 03.05.2020 13:41


Biology, 03.05.2020 13:41


History, 03.05.2020 13:41


Mathematics, 03.05.2020 13:41

Mathematics, 03.05.2020 13:41

Mathematics, 03.05.2020 13:41


Mathematics, 03.05.2020 13:41


