
Mathematics, 24.07.2019 22:00 rockstargirl7256
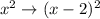
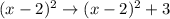
Which best describes the transformation that occurs from the graph of f(x) = x2 to g(x) = (x – 2)2 + 3? right 2, up 3 left 2, down 3 right 2, down 3 left 2, up 3

Answers: 1
 and
and 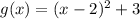


Another question on Mathematics
Mathematics, 21.06.2019 18:40
Which compound inequality could be represented by the graph?
Answers: 1
Mathematics, 21.06.2019 19:00
Asmall business produces and sells balls. the fixed costs are $20 and each ball costs $4.32 to produce. each ball sells for $8.32. write the equations for the total cost, c, and the revenue, r, then use the graphing method to determine how many balls must be sold to break even.
Answers: 3
Mathematics, 21.06.2019 20:50
Amanda went into the grocery business starting with five stores. after one year, she opened two more stores. after two years, she opened two more stores than the previous year. if amanda expands her grocery business following the same pattern, which of the following graphs represents the number of stores she will own over time?
Answers: 3
Mathematics, 21.06.2019 22:30
Assume that y varies inversely with x. if y=1.6 when x=0.5 find x when y=3.2
Answers: 1
You know the right answer?
Which best describes the transformation that occurs from the graph of f(x) = x2 to g(x) = (x – 2)2 +...
Questions

Mathematics, 23.05.2020 04:00
Mathematics, 23.05.2020 04:00
Mathematics, 23.05.2020 04:00


Mathematics, 23.05.2020 04:01

History, 23.05.2020 04:01


