Mathematics, 24.07.2019 20:00 katie18147
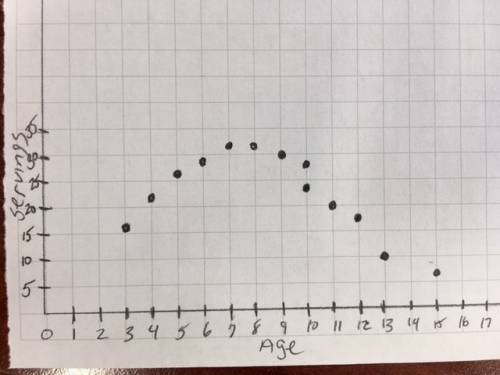
45 points plez mee 2. the table shows children’s ages and the number of servings of vegetables the children ate each week. (a) create a scatter plot of the data. (b) do the points appear to follow a linear pattern? if so, is the correlation positive or negative? (also really if you create the scatter plot or tell me the points) age servings of vegetables 15 6 7 32 8 32 9 30 11 20 3 16 4 22 5 26 6 29 10 27 10 24 12 17 13 10

Answers: 1


Another question on Mathematics

Mathematics, 21.06.2019 15:00
Asap the total attendance for all of a baseball league in 2012 was about 7.5×10⁷ fans, while the attendance for the tornadoes in 2012 was about 1.5×10⁶ fans. about how many times more was the attendance for the entire baseball league than the attendance for just the tornadoes? 50 times more 10 times more 2 times more 5 times more
Answers: 2

Mathematics, 21.06.2019 19:30
Abird on top of a 200 ft bridge tower sees a man standing on the lower part of the bridge (which is 50 ft above the ground). the angle of depression from the bird is 26 ̊. how far is the man from the base of the bridge tower? with explanation and pictures .
Answers: 1

Mathematics, 22.06.2019 00:00
Lana's family entered a 5-kilometer race lana's average step length is about 0.5 meter how many steps will she need to take the finish
Answers: 1

Mathematics, 22.06.2019 00:00
If two parallel lines are cut by a transversal, interior angles on the same side of the transversal are supplementary. a. always b. sometimes c. never
Answers: 2
You know the right answer?
45 points plez mee 2. the table shows children’s ages and the number of servings of vegetables the...
Questions

Mathematics, 31.05.2021 09:50

Social Studies, 31.05.2021 09:50

Mathematics, 31.05.2021 09:50

Mathematics, 31.05.2021 09:50

History, 31.05.2021 09:50

Mathematics, 31.05.2021 09:50


Law, 31.05.2021 09:50


Mathematics, 31.05.2021 09:50


Mathematics, 31.05.2021 09:50

English, 31.05.2021 09:50

Mathematics, 31.05.2021 09:50

World Languages, 31.05.2021 09:50


Mathematics, 31.05.2021 09:50


