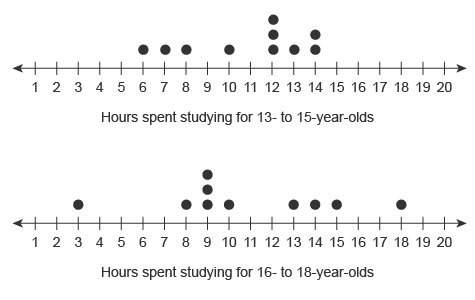
The line plot shows the number of hours two groups of teens spent studying last week.
ho...

Mathematics, 09.01.2020 14:31 christheicebear
The line plot shows the number of hours two groups of teens spent studying last week.
how does the data compare for the two groups of teens?
the 13- to 15-year olds spent an average of 14 hours studying last week.
the median value for the hours spent studying last week for the 13- to 15-year olds is greater than the median value for the hours spent studying last week for the 16- to 18-year olds.
the range for the hours spent studying last week for the 13- to 15-year olds is the same as the range for the hours spent studying last week for the 16- to 18-year olds.
the mode for the hours spent studying last week for the 13- to 15-year olds is less than the mode for the hours spent studying last week for the 16- to 18-year olds.

Answers: 1


Another question on Mathematics
Mathematics, 21.06.2019 19:00
Billy plotted −3 4 and −1 4 on a number line to determine that −3 4 is smaller than −1 4 is he correct? explain why or why not?
Answers: 3
Mathematics, 21.06.2019 22:30
Convert (-3,0) to polar form. a. (3,0’) b. (-3,180’) c. (3,180’) d. (3,360’)
Answers: 1
Mathematics, 21.06.2019 22:30
Reinel saves 30% of every pay check. his paycheck last week was 560$. how much did reniel save last week?
Answers: 2
You know the right answer?
Questions
Mathematics, 01.11.2019 04:31

English, 01.11.2019 04:31
Mathematics, 01.11.2019 04:31

Biology, 01.11.2019 04:31


Computers and Technology, 01.11.2019 04:31


