
Mathematics, 22.07.2019 02:01 mykamorrow
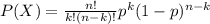
Anew medical test provides a false positive result for hepatitis 2% of the time that is a perfectly healthy subject being tested for hepatitis will test as being infected 2% of the time. and research, the test is given to 30 healthy (not having hepatitis) subjects. let x be the number of subjects who test positive for the disease a. what is the probability that all 30 subjects will appropriately test as not being infected? b. what are the mean and standard deviation of x? c. to what extent do you think this is a viable test to use in the field of medicine?

Answers: 1


Another question on Mathematics
Mathematics, 21.06.2019 12:30
What is the percent of increase for a population that changed from 438,000 to 561,000
Answers: 1
Mathematics, 21.06.2019 16:00
Part one: measurements 1. measure your own height and arm span (from finger-tip to finger-tip) in inches. you will likely need some from a parent, guardian, or sibling to get accurate measurements. record your measurements on the "data record" document. use the "data record" to you complete part two of this project. name relationship to student x height in inches y arm span in inches archie dad 72 72 ginelle mom 65 66 sarah sister 64 65 meleah sister 66 3/4 67 rachel sister 53 1/2 53 emily auntie 66 1/2 66 hannah myself 66 1/2 69 part two: representation of data with plots 1. using graphing software of your choice, create a scatter plot of your data. predict the line of best fit, and sketch it on your graph. part three: the line of best fit include your scatter plot and the answers to the following questions in your word processing document 1. 1. which variable did you plot on the x-axis, and which variable did you plot on the y-axis? explain why you assigned the variables in that way. 2. write the equation of the line of best fit using the slope-intercept formula $y = mx + b$. show all your work, including the points used to determine the slope and how the equation was determined. 3. what does the slope of the line represent within the context of your graph? what does the y-intercept represent? 5. use the line of best fit to you to describe the data correlation.
Answers: 2
Mathematics, 22.06.2019 01:30
What is the solution for the following system of equations? use any method to solve. 2x + 8y = 4 x = -3y + 5 question 4 options: x = 14, y= -3 x = 2, y = -3 x = -3, y = -3 x = 12, y = 5
Answers: 1
You know the right answer?
Anew medical test provides a false positive result for hepatitis 2% of the time that is a perfectly...
Questions


Mathematics, 27.02.2020 00:10


Arts, 27.02.2020 00:10

Mathematics, 27.02.2020 00:10

Advanced Placement (AP), 27.02.2020 00:10

Computers and Technology, 27.02.2020 00:10

History, 27.02.2020 00:10


