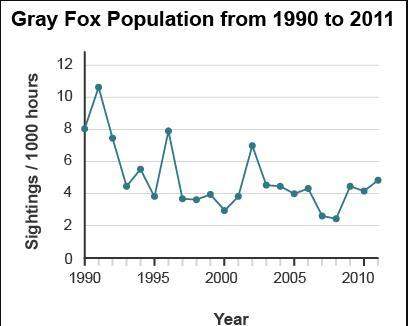
the graph shows the population of gray fox in an area of the united states.
which best de...

Physics, 27.09.2019 15:20 xTrippyBeach4201x
the graph shows the population of gray fox in an area of the united states.
which best describes the population size between 1990 and 2011?
mostly stable and unchanged
many increases and decreases but declined overall
slowly increased over time
several sharp declines but grew overall

Answers: 1


Another question on Physics
Physics, 22.06.2019 08:30
Brutus, the dog, is pulling a bone to the left with a force of 20 n. lassie, another dog, is pulling a bone to the right with a force of 18n. what is the net force? a. b. c.
Answers: 1
Physics, 22.06.2019 09:30
In a heat engine if 1000 j of heat enters the system the piston does 500 j of work, what is the final internal energy of the system if the initial energy was 2000 j? 1. write the equation 2.list out your known variables 3.plug the numbers into the equations 4.solve 5.write your solution statement that includes initial energy and final
Answers: 3
Physics, 23.06.2019 00:10
During cooling, the kinetic energy of the molecules falls. why does this happen? a.the motion of the molecules increases. b. the motion of the molecules slows down. c.the van der waals forces between molecules decrease d. the forces of attraction between the molecules are overcome.
Answers: 2
You know the right answer?
Questions

Mathematics, 08.01.2021 18:20

Social Studies, 08.01.2021 18:20


Biology, 08.01.2021 18:20
Mathematics, 08.01.2021 18:20
English, 08.01.2021 18:20


History, 08.01.2021 18:20
Mathematics, 08.01.2021 18:20
Mathematics, 08.01.2021 18:20
Mathematics, 08.01.2021 18:20
English, 08.01.2021 18:20


