
Physics, 27.11.2019 19:31 HappyBeatrice1401
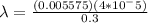
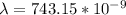
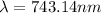
You measure distances from the center of a diffraction pattern (y) to a series of dark fringes on a screen that is 0.3000 ± 0.0005 m away from the 0.04-mm wide slit you are using to create the pattern. you create a plot of y (in m) vs m and get a slope for the best-fit line of 0.005525 ± 8.175 10-6. what is the wavelength of the laser you used to collect the data?

Answers: 2

 Wavelength
  , we have that


Another question on Physics
Physics, 22.06.2019 08:30
If an astronaut takes an object to the moon the following is true (choose only one). a the mass will change but the weight will be the same. b both the mass and the weight of the object will be the same. c the weight will change but the mass will be the same. d both the mass and the weight of the object will change.
Answers: 1
Physics, 22.06.2019 16:40
Aparticle's position is given by x = 3.00 - 9.00t + 3t2, in which x is in meters and t is in seconds. (a) what is its velocity at t = 1 s? (b) is it moving in the positive or negative direction of x just then? (c) what is its speed just then? (d) is the speed increasing or decreasing just then? (try answering the next two questions without further calculation.) (e) is there ever an instant when the velocity is zero? if so, give the time t; if not, answer "0". (f) is there a time after t = 3 s when the particle is moving in the negative direction of x? if so, give the time t; if not, answer "0".
Answers: 3
Physics, 23.06.2019 02:10
Find the steady-state temperature at the center of the plate = /2, = /2) for sums of w from n=1 to n=19 (only odd values). find the value of n for which the change in /2, /2) is less than 1% from the value at the previous n. at this point, we consider the solution converged. does the value of the temperature at the center seem reasonable? in this part, the values of x and y are constant scalar values. you should produce a plot of the value of n on the horizontal and the estimate of the temperature at the center of the plate on the vertical. b. using the value of n (or larger) that resulted in convergence in part (a), create a contourf plot of the temperature distribution across the entire plate. use enough spatial subdivisions to create a useful plot. comment on the results. hint: you need to determine what “x” and “y” values to use to make your t matrix. i recommend using a different number of x and y values. use enough x and y values so that the plot is “smooth”.
Answers: 1
You know the right answer?
You measure distances from the center of a diffraction pattern (y) to a series of dark fringes on a...
Questions

Mathematics, 14.04.2021 14:00

English, 14.04.2021 14:00
Mathematics, 14.04.2021 14:00
Mathematics, 14.04.2021 14:00
English, 14.04.2021 14:00
English, 14.04.2021 14:00
Mathematics, 14.04.2021 14:00

Computers and Technology, 14.04.2021 14:00
Mathematics, 14.04.2021 14:00


Geography, 14.04.2021 14:00
Mathematics, 14.04.2021 14:00
Mathematics, 14.04.2021 14:00


