
Physics, 02.09.2020 23:01 mathiscool7
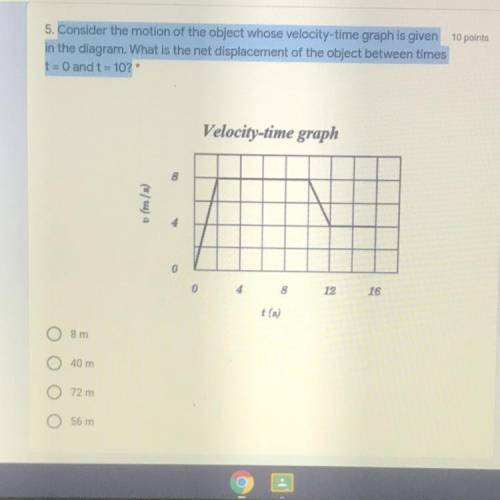
5. Consider the motion of the object whose velocity-time graph is given 1950
in the diagram. What is the net displacement of the object between times
t = 0 and t = 102
Velocity-time graph
12 15
72m
56 m

Answers: 1


Another question on Physics
Physics, 22.06.2019 04:50
*drag each tile to the correct location in the sequence* the table shows chronological events in the life of our sun, a medium-sized star. place the missing events into the correct rows of the table.
Answers: 3
Physics, 22.06.2019 15:00
Consider a uniformly charged ring in the xy plane, centered at the origin. the ring has radius a and positive charge qdistributed evenly along its circumference. a)what is the direction of the electric field at any point on the z axis? . b)what is the magnitude of the electric field along the positive z axis? use k in your answer, where k=14πϵ0. d)the ball will oscillate along the z axis between z=d and z=−d in simple harmonic motion. what will be the angular frequency ω of these oscillations? use the approximation d≪a to simplify your calculation; that is, assume that d2+a2≈a2. express your answer in terms of given charges, dimensions, and constants
Answers: 2
Physics, 22.06.2019 19:30
Scientist have use computer models to create a series of maps that show how susceptible coastal cities in island countries are to the sea rising at different levels.the map shows that a 1 meter rise would swap cities all along the us eastern seaboard. a 6-meter sea level rise with sub merge a large part of florida. thermal expansion has already raise the oceans 10 to 20 centimeters the most likely cause,directly and indirectly, for such a rise in sea level is
Answers: 2
Physics, 22.06.2019 21:30
Which sections of the heating curve illustrate this process?
Answers: 2
You know the right answer?
5. Consider the motion of the object whose velocity-time graph is given 1950
in the diagram. What i...
Questions

Mathematics, 22.06.2019 11:30
Mathematics, 22.06.2019 11:30


English, 22.06.2019 11:30
English, 22.06.2019 11:30

Chemistry, 22.06.2019 11:30
Physics, 22.06.2019 11:30


