Physics, 02.10.2020 16:01 MayFlowers
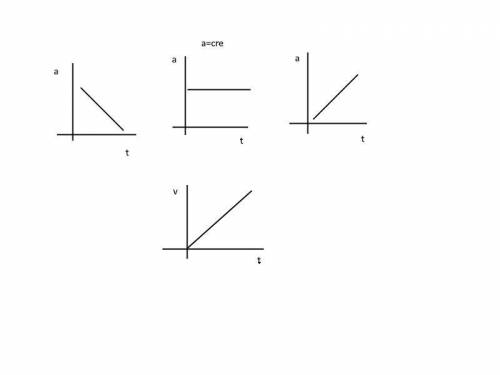
1. How would you expect an instantaneous acceleration vs. time graph to look for a cart moving with a constant
acceleration? With a uniformly increasing acceleration? With a uniformly decreasing acceleration? Make a rough
sketch of the graph for each possibility and explain your reasoning. To make the comparison easier, it is useful to
draw these graphs next to each other. Remember to assign labels and units to your axes. Write down an equation
for each graph. Explain what the symbols in each of the equations mean. What quantities in these equations can
you determine from your graph?
2. Write down the relationship between the acceleration and the velocity of the cart. Use that relationship to
construct an instantaneous velocity versus time graph just below each of your acceleration versus time graphs
from question 1, with the same scale for each time axis. Write down an equation for each graph. Explain what the
symbols in each of the equations mean. What quantities in these equations can you determine from your graph?
3. Write down the relationship between the velocity and the position of the cart. Use that relationship to construct a
position versus time graph just below each of your velocity versus time graphs from question 2, with the same
scale for each time axis. Write down an equation for each graph. Explain what the symbols in each of the
equations mean. What quantities in these equations can you determine from your graph?

Answers: 1


Another question on Physics

Physics, 22.06.2019 00:30
Using the work energy theorem. what is the velocity of a 850kg car after starting at rest when 13,000j of work is done to it.
Answers: 1

Physics, 22.06.2019 01:10
Aparticle initially moving east with a speed of 20.0 m/s, experiences an acceleration of 3.95 m/s, north for a time of 8.00 s. what was the speed of the particle after this acceleration, in units of m/s? give the answer as a positive number.
Answers: 1


Physics, 22.06.2019 10:00
In a heat engine if 1000 j of heat enters the system the piston does 500 j of work, what is the final internal energy of the system if the initial energy was 2000 j? 1. write the equation 2.list out your known variables 3.plug the numbers into the equations 4.solve 5.write your solution statement that includes initial energy and final
Answers: 3
You know the right answer?
1. How would you expect an instantaneous acceleration vs. time graph to look for a cart moving with...
Questions

Mathematics, 05.09.2019 18:30


History, 05.09.2019 18:30

Mathematics, 05.09.2019 18:30


Computers and Technology, 05.09.2019 18:30


Computers and Technology, 05.09.2019 18:30


