
Physics, 30.10.2020 17:00 janayshas84
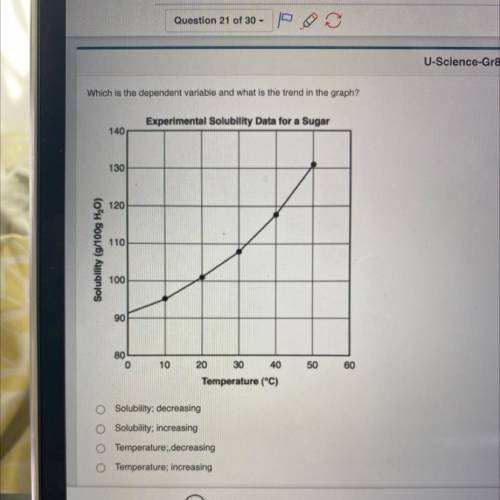
Which is the dependent variable and what is the trend in the graph?
Experimental Solubility Data for a Sugar
140
130
120
110
Solubility (g/100g H,0)
100
90
80
0
10
50
60
20 30 40
Temperature (*C)
Solubility; decreasing
Solubility; increasing
Temperature; decreasing
Temperature; increasing

Answers: 3


Another question on Physics
Physics, 21.06.2019 18:40
An observer that stands still as the electron moves by him, will observe
Answers: 3
Physics, 21.06.2019 23:20
Initially, a particle is moving at 5.33 m/s at an angle of 37.9° above the horizontal. two seconds later, its velocity is 6.11 m/s at an angle of 54.2° below the horizontal. what was the particle's average acceleration during these 2.00 seconds in the x-direction (enter first) and the y-direction?
Answers: 1
Physics, 22.06.2019 13:50
Observations show that interstellar clouds can have almost any shape and
Answers: 1
Physics, 22.06.2019 16:00
What part of the ear is names after tools, such as the hammer and the anvil?
Answers: 1
You know the right answer?
Which is the dependent variable and what is the trend in the graph?
Experimental Solubility Data fo...
Questions


Social Studies, 27.07.2019 23:30

History, 27.07.2019 23:30
Physics, 27.07.2019 23:30
English, 27.07.2019 23:30

Mathematics, 27.07.2019 23:30
History, 27.07.2019 23:30

Mathematics, 27.07.2019 23:30
Mathematics, 27.07.2019 23:30
English, 27.07.2019 23:30
Mathematics, 27.07.2019 23:30


