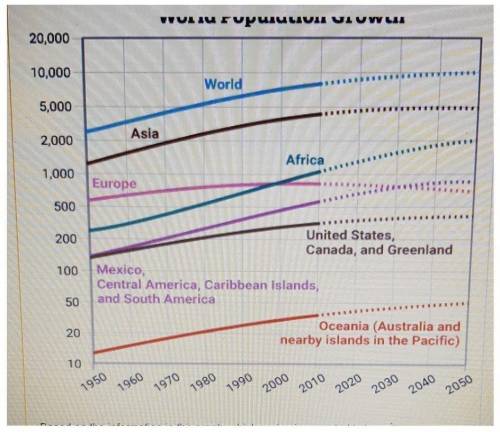
The graph shows projected changes in the populations of the world.
World Population Growth
20...

Physics, 17.01.2021 04:40 pineapplepizaaaaa
The graph shows projected changes in the populations of the world.
World Population Growth
20,000
10,000
World
5,000
Asia
2,000
Africa
1,000
Europe
500
200
United States,
Canada, and Greenland
100 Mexico
Central America, Caribbean Islands,
50
and South America
Oceania (Australia and
20
nearby islands in the Pacific)
10
2040
2050
Based on the information in the graph, which region is expected to have the
greatest increase in its population over the period shown?
1950
1960
1970
1980
1990
2000
2010
2020
2030

Answers: 1


Another question on Physics
Physics, 22.06.2019 07:00
Abucket full of water weights 4 kg and water well is 10m deep. a girl draws water from the well. it takes the girl 3 minutes to draw a bucket full of water from the well. what is the power of the girl?
Answers: 1
Physics, 23.06.2019 01:00
Are formed where bumps from two surfaces come into contact ?
Answers: 1
Physics, 23.06.2019 01:00
What happens to the vapor pressure of a substance when its surface area is increased at constant temperature?
Answers: 3
Physics, 23.06.2019 12:00
What was the approximate temperature of the universe at an age of 1015 s?
Answers: 3
You know the right answer?
Questions


English, 21.04.2020 02:08


Mathematics, 21.04.2020 02:08
Chemistry, 21.04.2020 02:08
Mathematics, 21.04.2020 02:08
English, 21.04.2020 02:09

Mathematics, 21.04.2020 02:10
Mathematics, 21.04.2020 02:10


