
Physics, 12.03.2021 01:30 jacksonsmith0
Help will give 15 points
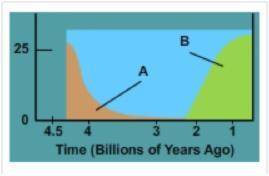
In graph two, label A represents the gases hydrogen sulfide, methane, and carbon dioxide. What gases are represented by label B and how do these gas levels relate to the evolution of photosynthetic organisms?
Description of Graph:
The graph depicts the percentages of oxygen and carbon dioxide in Earth's atmosphere over time. The x-axis shows time in billions of years, and the y-axis shows percentages. Two curved lines depict the changing values of oxygen and carbon dioxide in the Earth's atmosphere over that time, but the lines are labeled with the variables "A" and "B."
The line labeled with the variable "A" depicts a substance with a percentage starting just above twenty five percent at 4.3 billion years ago. The percentage of this substance in the atmosphere decreases to about five percent by 4 billion years ago, and reaches a steady value of about one percent from 3.5 billion years ago to the end of the graph. The line depicting the second substance, labeled with the variable "B," appears around 2.3 billion years ago. It grows from zero to five percent by 2 billion years ago. The percentage of substance B in the atmosphere increases steadily, passing 20 percent by 1.5 billion years ago and leveling out at around 30 percent by 1 billion years ago.

Answers: 3


Another question on Physics
Physics, 22.06.2019 03:00
Which boundary is associated with the building of the himalaya mountains? convergent transform divergent hot spot
Answers: 1
Physics, 22.06.2019 06:00
The frequency of vibrations of a vibrating violin string is given by f = 1 2l t ρ where l is the length of the string, t is its tension, and ρ is its linear density.† (a) find the rate of change of the frequency with respect to the following. (i) the length (when t and ρ are constant) (ii) the tension (when l and ρ are constant) (iii) the linear density (when l and t are constant) (b) the pitch of a note (how high or low the note sounds) is determined by the frequency f. (the higher the frequency, the higher the pitch.) use the signs of the derivatives in part (a) to determine what happens to the pitch of a note for the following. (i) when the effective length of a string is decreased by placing a finger on the string so a shorter portion of the string vibrates df dl 0 and l is ⇒ f is ⇒ (ii) when the tension is increased by turning a tuning peg df dt 0 and t is ⇒ f is ⇒ (iii) when the linear density is increased by switching to another string df dρ 0 and ρ is ⇒ f is ⇒
Answers: 3
Physics, 22.06.2019 07:30
The slope of a velocity time graph over any interval of time gives the during that interval
Answers: 2
Physics, 22.06.2019 17:00
Adiver named jacques observes a bubble of air rising from the bottom of a lake (where the absolute pressure is 3.50 atm) to the surface (where the pressure is 1.00 atm). the temperature at the bottom is 4.00 ∘c, and the temperature at the surface is 23.0 ∘c.what is the ratio of the volume of the bubble as it reaches the surface (vs) to its volume at the bottom (vb)? if jaques were to hold his breath the air in his lungs would be kept at a constant temperature. would it be safe for jacques to hold his breath while ascending from the bottom of the lake to the surface?
Answers: 1
You know the right answer?
Help will give 15 points
In graph two, label A represents the gases hydrogen sulfide, methane, and...
Questions


Chemistry, 24.11.2019 04:31
Mathematics, 24.11.2019 04:31
Mathematics, 24.11.2019 04:31

Mathematics, 24.11.2019 04:31
Mathematics, 24.11.2019 04:31
English, 24.11.2019 04:31
Mathematics, 24.11.2019 04:31


Mathematics, 24.11.2019 04:31


