
Physics, 07.11.2019 00:31 amberwithnell12512
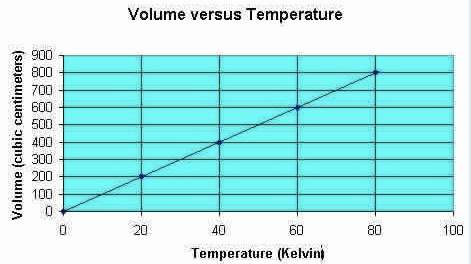
The accompanying graph represents the theoretical relationship between the volume and the temperature of a gas under constant pressure. image according to this graph, the volume of the gas is (5 points) select one: a. directly proportional to the square of the temperature b. directly proportional to the temperature c. inversely proportional to the temperature d. inversely proportional to the square of the temperature

Answers: 1


Another question on Physics
Physics, 22.06.2019 04:20
Awave is produced in a rope. the wave has a speed of 33 m/s and a frequency of 22 hz. what wavelength is produced?
Answers: 2
Physics, 22.06.2019 06:00
When you push downward on a book at rest on a table, you feel an upward force. does this force depend on friction? defend your answer.
Answers: 2
Physics, 22.06.2019 09:00
The pressure proportional to the area a- inversely b- directly c- increase d-decrease
Answers: 2
You know the right answer?
The accompanying graph represents the theoretical relationship between the volume and the temperatur...
Questions


Mathematics, 04.01.2021 20:30

History, 04.01.2021 20:30

History, 04.01.2021 20:30

English, 04.01.2021 20:30

Mathematics, 04.01.2021 20:30
Mathematics, 04.01.2021 20:30
History, 04.01.2021 20:30
Mathematics, 04.01.2021 20:30
Social Studies, 04.01.2021 20:30
Mathematics, 04.01.2021 20:30
English, 04.01.2021 20:30
Mathematics, 04.01.2021 20:30


