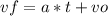

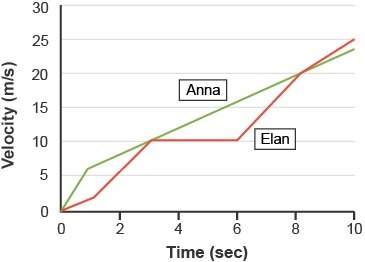
The graph depicts the velocity and times of elan and anna during a race.
which best depicts the...

Physics, 02.09.2019 17:00 ivankerwin
The graph depicts the velocity and times of elan and anna during a race.
which best depicts the data?
from 0 to 2 seconds, anna experienced negative acceleration.
from 3 to 6 seconds, elan accelerated while anna did not.
from 6 to 8 seconds, elan accelerated faster than anna.
from 8 to 10 seconds, elan experienced negative acceleration.

Answers: 2


Another question on Physics
Physics, 21.06.2019 16:30
Which of the following would not be taken into consideration when describing the quality of a sound
Answers: 2
Physics, 21.06.2019 17:50
Which describes an image that can be produced by a concave lens? the image is real and smaller than the object. the image is virtual and larger than the object. the image is virtual and smaller than the object. the image is real and larger than the object.
Answers: 3
Physics, 21.06.2019 23:10
Which are examples of projectile motion? choose all that apply a. a soccer ball rolling across the ground in the northeast direction b. a car turning a corner, so it is heading south c. a javelin flying through the air d. a tennis ball lobbed over the net
Answers: 1
Physics, 22.06.2019 09:00
Inside of a windmill or a dam is a that is used to transform one type of energy into electrical energy. a. motor b. generator c. transformer d. power pack
Answers: 2
You know the right answer?
Questions


Mathematics, 27.09.2020 14:01
Mathematics, 27.09.2020 14:01

Health, 27.09.2020 14:01

Mathematics, 27.09.2020 14:01

Social Studies, 27.09.2020 14:01
Mathematics, 27.09.2020 14:01
Mathematics, 27.09.2020 14:01
Health, 27.09.2020 14:01
Social Studies, 27.09.2020 14:01
Biology, 27.09.2020 14:01


