
Physics, 06.07.2021 18:30 harpermags7830
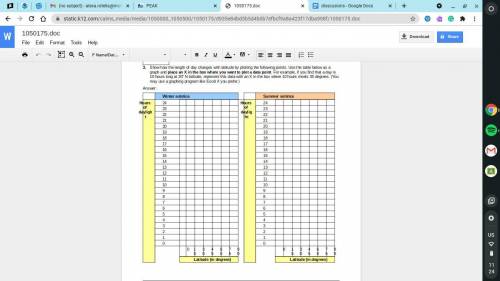
Show how the length of day changes with latitude by plotting the following points. Use the table below as a graph and place an X in the box where you want to plot a data point. For example, if you find that a day is 10 hours long at 30° N latitude, represent this data with an X in the box where 10 hours meets 30 degrees. (You may use a graphing program like Excel if you prefer.)

Answers: 2


Another question on Physics
Physics, 22.06.2019 07:00
The table below shows the acceleration of gravity on different bodies in the solar system. on which body would a 10 kg lamp has the most gravitational potential energy when lifted to a height of 2 m? a. earth b. mars c. neptune d. uranus
Answers: 1
Physics, 22.06.2019 16:00
What part of the ear is names after tools, such as the hammer and the anvil?
Answers: 1
Physics, 22.06.2019 20:00
Aspectroscope breaks light up into its colors, allowing scientists to analyze light from the solar system and universe. by studying the spectral line patterns, widths, strengths and positions, scientists can determine the speed, position, and of celestial bodies. a) age b) origin c) rotation d) temperature
Answers: 1
Physics, 23.06.2019 00:30
What is the relationship between wavelength of light and the quantity of energy per photon?
Answers: 2
You know the right answer?
Show how the length of day changes with latitude by plotting the following points. Use the table bel...
Questions

Social Studies, 27.07.2019 23:30


Mathematics, 27.07.2019 23:30


Biology, 27.07.2019 23:30
Mathematics, 27.07.2019 23:30
Mathematics, 27.07.2019 23:30


