Physics, 17.09.2021 03:10 esmemaluma00
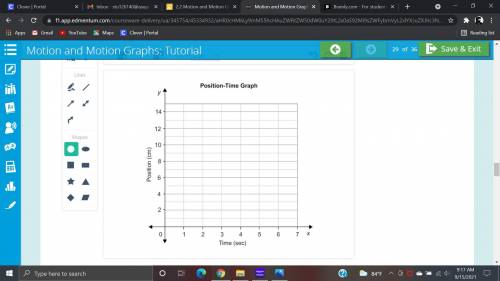
The position data for line 2 was recorded in 1-second intervals. Draw a graph with distance on the y-axis and elapsed time on the x-axis. Reference all distance and time measurements to dot 1. To plot a point, use the circle tool. To draw a line between points, use the line tool. To move a point or line, use the select tool.


Answers: 1


Another question on Physics

Physics, 21.06.2019 15:50
Ahollow metal sphere has 6 cm and 11 cm inner and outer radii, respectively. the surface charge density on the inside surface is −100nc/m2. the surface charge density on the exterior surface is:
Answers: 1

Physics, 21.06.2019 23:50
Any color picture tube and electric field exerts a net force of magnitude 1.68x 10^-13 n on an electron the rest mass of an electron is 9.11 x 10^-13 what is the electron acceleration?
Answers: 3

Physics, 22.06.2019 05:30
Imagine that someone pushes one marble toward a motionless marble. would there still be action-reaction forces involved in the collision? how might the marbles’ motions be changed? ?
Answers: 1

Physics, 22.06.2019 11:30
Why is the energy that results from a roller coaster's position at the top of a hill referred to as potential energy?
Answers: 1
You know the right answer?
The position data for line 2 was recorded in 1-second intervals. Draw a graph with distance on the y...
Questions


Mathematics, 10.04.2020 01:04

Mathematics, 10.04.2020 01:04


Health, 10.04.2020 01:04


Biology, 10.04.2020 01:05

Mathematics, 10.04.2020 01:05

Mathematics, 10.04.2020 01:05


Mathematics, 10.04.2020 01:05

Chemistry, 10.04.2020 01:05

Mathematics, 10.04.2020 01:05


History, 10.04.2020 01:05


