Lab
Identifyinying the relationship between mass and thermal energy transfer:
Which graph bes...

Physics, 14.10.2021 18:30 catherinesquitieri
Lab
Identifyinying the relationship between mass and thermal energy transfer:
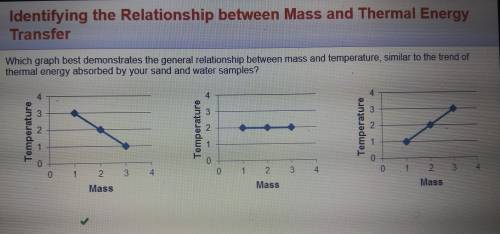
Which graph best demonstrates the general relationship between mass and temperature, similar to the trend of mermal energy absorbed by your sand and water samples? ✓4 4 3 Temperature 2 Temperature Temperature - 0 1 2 3 4 0 1 2 3 4 0 1 2 3 Mass Mass Mass
A; the first one. Check Pic for reference

Answers: 1


Another question on Physics
Physics, 22.06.2019 08:00
What is the average speed of a car that travels 40 mph for 1 hour and 60 mph in another hour?
Answers: 1
Physics, 22.06.2019 10:30
In automobile steering wheel is shown what is the ideal mechanical advantage blank? if the ama is eight what is the efficiency of the steering wheel?
Answers: 1
Physics, 22.06.2019 12:10
Consider a one meter long horizontal pipe with a constant 100 cm^2 cross sectional area. water flows rightward into the pipe at x = 0 with flow velocity 02m/sec at every point within the pipe intake area. at x=1, the rightward flow rate is 0.192 m/sec. assume the water is a conserved quantity in the pipe, so there must be a leak (a sink) somewhere in the pipe. 1. compute net volumetric flow of the source if the system to be in equilibrium. 2. now assume the pipe in the problem has no leaks. compute the net volumetric rate of change for the system.
Answers: 3
You know the right answer?
Questions

Computers and Technology, 09.07.2019 09:30


Mathematics, 09.07.2019 09:30
Biology, 09.07.2019 09:30
Mathematics, 09.07.2019 09:30


English, 09.07.2019 09:30

Health, 09.07.2019 09:30
Mathematics, 09.07.2019 09:30
Mathematics, 09.07.2019 09:30


