
Physics, 10.11.2021 18:40 delaneyjane1599
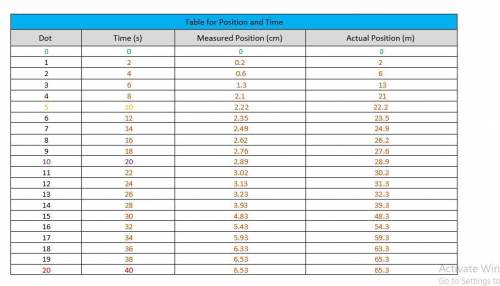
4. Plot a graph of (actual) position vs time using the data in the table above. The graph must have the correct labels for the title, axes, and units. You can plot it by hand on graph paper, or take a picture and paste it here. (Alternatively, you could also use Microsoft Excel to generate the graph and paste that chart here.)
5. Using the position–time graph, calculate the velocity of the formula 1 for the time period when the velocity is constant. Please show your calculation and answer below. (Hint: between 10 and 20 seconds).
6. Using the data from step 4 and the fact that the car started from rest at zero seconds and came to rest at 40 seconds, Plot the corresponding velocity-time graph for the motion of the Formula 1 car. The graph must have the correct labels for the title, axes, and units. You can plot it by hand on graph paper, or take a picture and paste it here. (Alternatively, you could also use Microsoft Excel to generate the graph and paste that chart here.)
7. Using the velocity-time graph, calculate the acceleration of the Formula 1 car for the time period when the Formula 1 car has positive acceleration. Please show your calculation and answer below.
8. Using the velocity-time graph, calculate the acceleration of the Formula 1 car for the time period when the Formula 1 car has negative acceleration. Please show your calculation and answer below.
9. Plot the corresponding acceleration-time graph for the motion of the Formula 1 car. The graph must have the correct labels for the title, axes, and units. You can plot it by hand on graph paper, or take a picture and paste it here. (Alternatively, you could also use Microsoft Excel to generate the graph and paste that chart here.)

Answers: 2


Another question on Physics
Physics, 22.06.2019 12:50
Assume you measured the mass of the cart to be (500 ± 1) g and the mass of the additional mass you put on the cart to be (500 ± 1) g as well. since the scale you are using in the lab cannot measure objects heavier than 600g you will have to sum up individual pieces and propagate the error. so what would be the mass and the standard error of the cart and the mass
Answers: 3
Physics, 22.06.2019 18:30
In the united states, tornadoes generally occur because of the freezing of ocean water underwater earthquakes meeting of cool and warm air masses shifting of warm and cool ocean currents
Answers: 1
Physics, 22.06.2019 20:30
Suppose a force of 60 n is required to stretch and hold a spring 0.1 m from its equilibrium position. a. assuming the spring obeys hooke's law, find the spring constant k. b. how much work is required to compress the spring 0.5 m from its equilibrium position? c. how much work is required to stretch the spring 0.6 m from its equilibrium position? d. how much additional work is required to stretch the spring 0.1 m if it has already been stretched 0.1 m from its equilibrium? a. kequals 600
Answers: 2
You know the right answer?
4. Plot a graph of (actual) position vs time using the data in the table above. The graph must have...
Questions

English, 11.10.2020 18:01

Mathematics, 11.10.2020 18:01

Arts, 11.10.2020 18:01

Biology, 11.10.2020 18:01


History, 11.10.2020 18:01
English, 11.10.2020 18:01
Mathematics, 11.10.2020 18:01
Physics, 11.10.2020 18:01
Physics, 11.10.2020 18:01
History, 11.10.2020 18:01
Biology, 11.10.2020 18:01
English, 11.10.2020 18:01

Business, 11.10.2020 18:01
Mathematics, 11.10.2020 18:01

Computers and Technology, 11.10.2020 18:01
English, 11.10.2020 18:01


