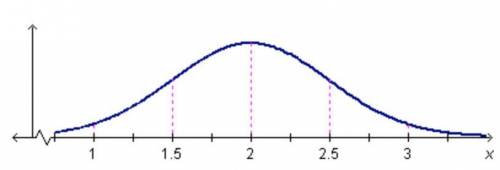
The graph shows a distribution of data. What is the standard deviation of the data?
A. 0....

SAT, 16.02.2020 07:20 RegencySlayer5304
The graph shows a distribution of data. What is the standard deviation of the data?
A. 0.5
B. 1.5
C. 2.0
D. 2.5
Answers: 2


Another question on SAT
SAT, 23.06.2019 06:30
How often do neap tides occur? a. about once a month b. about twice a month c. about once a year d. about twice a year
Answers: 1
SAT, 23.06.2019 06:30
How long must a student wait for feedback on how they did on the accuplacer? a. 1 day b. 1 week c. 1 month d. immediate feedback (no wait)
Answers: 1
You know the right answer?
Questions

Mathematics, 22.07.2019 23:00

English, 22.07.2019 23:00
English, 22.07.2019 23:00


Health, 22.07.2019 23:00

English, 22.07.2019 23:00
Health, 22.07.2019 23:00
Health, 22.07.2019 23:00

Business, 22.07.2019 23:00


