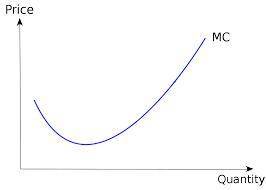
The graph is a marginal cost curve that compares expenses for producing apple pies.
acc...

Social Studies, 01.02.2020 10:42 mvazquez298
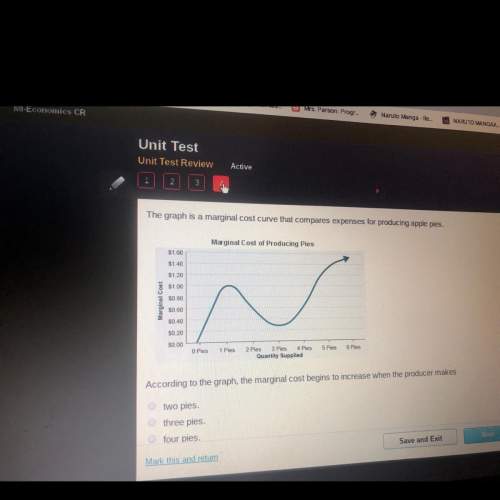
The graph is a marginal cost curve that compares expenses for producing apple pies.
according to the graph, the marginal cost begins to increase when the producer makes
a. two pies
b. three pies
c. four pies.
d. five pies

Answers: 2


Another question on Social Studies
Social Studies, 21.06.2019 13:30
The effective use of a knowledge technology should result in a(n):
Answers: 2
Social Studies, 22.06.2019 11:00
Which best describes the purpose of the south carolina exposition and protest, which was written by john c. calhoun? a) to explain why the south was nullifying the tariff of 1828 b) to describe the ways the tariff of 1828 would southerners c) to persuade northern states to rebel against the federal government d) to ask england for if the south decided to secede from the union
Answers: 3
Social Studies, 22.06.2019 14:20
Identify the constitutional principle that is common in both this excerpt and federalist no. 51. based on the constitutional principle identified in part (a), explain how the perspective in this excerpt compares with the perspective in federalist no. 51. explain how the constitutional principle identified in part (a) is reflected in the constitution, including two examples to explain how it affects the u.s. political system
Answers: 3
Social Studies, 22.06.2019 14:30
Dr. redbull conducts a study to determine whether her new energy drink children perform better on spelling tests. she randomly assigns children to one of two groups: group 1 receives her energy drink and group 2 receives water. she then gives both groups a spelling test and compares the results. which of the following is true about this study? a. group 1 is the dependent variable and group 2 is the independent variable. b. this is a correlational study. c. group 2 is the experimental group. d. the independent variable is the type of drink the children receive.
Answers: 3
You know the right answer?
Questions

Biology, 13.07.2019 08:30

Mathematics, 13.07.2019 08:30

World Languages, 13.07.2019 08:30
Mathematics, 13.07.2019 08:30
Mathematics, 13.07.2019 08:30

Mathematics, 13.07.2019 08:30


History, 13.07.2019 08:30
Physics, 13.07.2019 08:30
Biology, 13.07.2019 08:30
Biology, 13.07.2019 08:30

Business, 13.07.2019 08:30


