Social Studies, 14.08.2020 22:01 katiepotter
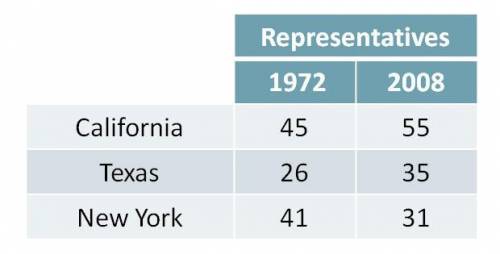
All of the following statements about the chart above are TRUE except: A. The number of representatives from New York decreased from 1972 to 2008. B. From 1972 to 2008, New York lost population while California and Texas grew larger. C. The number of representatives from California and Texas increased from 1972 to 2008. D. In 1972, California had the least number of representatives, but in 2008, it had the most. Please select the best answer from the choices provided A B C D


Answers: 3


Another question on Social Studies

Social Studies, 22.06.2019 23:20
How long was it from the time african american men were given the right to vote until women were given the right to vote?
Answers: 1

Social Studies, 23.06.2019 00:00
How did the romanov dynasty increase russia's power?
Answers: 1

Social Studies, 23.06.2019 00:40
The bill of rights includes things such as the right to bear arms and freedom of speech. these are examples of which american value?
Answers: 3

Social Studies, 23.06.2019 03:40
Social darwinism applies what theory to human society
Answers: 2
You know the right answer?
All of the following statements about the chart above are TRUE except: A. The number of representati...
Questions

Health, 16.10.2020 04:01

Mathematics, 16.10.2020 04:01


History, 16.10.2020 04:01


Physics, 16.10.2020 04:01


Mathematics, 16.10.2020 04:01


Advanced Placement (AP), 16.10.2020 04:01


