Social Studies, 06.10.2020 14:01 smcardenas02
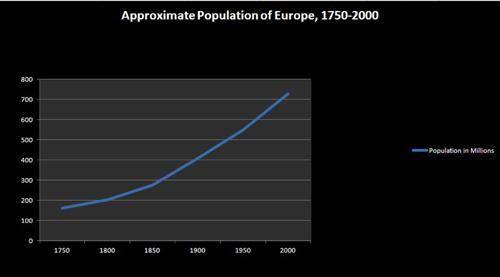
Use the graph below to answer the following question:
Which of the following is supported by the graph above?
A) The population growth rate of Europe has been the same since 1750.
B) The population growth rate of Europe has been increasing over time.
C) The population growth rate of Europe has been declining recently.
D) The population growth rate of Europe was higher in 1800 than 1950.


Answers: 3


Another question on Social Studies


Social Studies, 22.06.2019 23:40
What is donald trump wanting to build and have finished by 2020?
Answers: 2


Social Studies, 23.06.2019 14:30
Which worm is described by these characteristics? - is part of the phylum nematoda - has nostrils but no eyes - moves its body by bending from side to side
Answers: 1
You know the right answer?
Use the graph below to answer the following question:
Which of the following is supported by the gr...
Questions

Mathematics, 11.05.2021 23:50

English, 11.05.2021 23:50


Mathematics, 11.05.2021 23:50

Mathematics, 11.05.2021 23:50


Social Studies, 11.05.2021 23:50

Mathematics, 11.05.2021 23:50

History, 11.05.2021 23:50

Mathematics, 11.05.2021 23:50

Mathematics, 11.05.2021 23:50

Mathematics, 11.05.2021 23:50


Mathematics, 11.05.2021 23:50


Health, 11.05.2021 23:50


