
Social Studies, 16.10.2020 01:01 noahalderman83
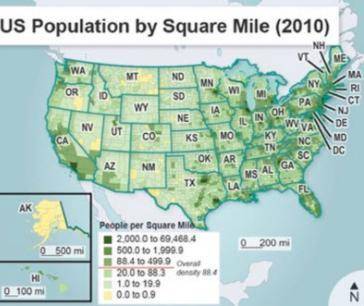
Examine the map showing US population distribution.
A map titled U S Population by Square Mile in 2010. A key notes the least amount of people to most amount of people from light to dark shading. Yellow shading is 0.0 to 0.9 people per square mile. Dark green shading is 2,000 to 69,468.4 people per square mile. A red line marks overall density is 88.4.
What conclusion can be drawn about the US population in 2010 from this map?
Texas had a lower population density than Montana.
New Jersey had a greater population than any other state.
Many Americans were migrating from the coasts to the interior.
The Northeast had the greatest population density in the nation.

Answers: 1


Another question on Social Studies
Social Studies, 20.06.2019 18:04
Why did other of the delian league resent athenian control
Answers: 2
Social Studies, 22.06.2019 03:10
Because jaedyn is a sociable, gregarious child, she tends to be noticed by her teachers and peers. how does jaedyn interact with her environment?
Answers: 3
Social Studies, 22.06.2019 20:00
What was the purpose of the federalist papers? a. to revise the articles of confederationb. to oppose ratification of the constitution c. to encourage support for the ratification of the constitutiond. to invite people to the constitutional convention
Answers: 2
Social Studies, 22.06.2019 22:40
Which of the following is a constitutional power that the president shares with the senate?
Answers: 1
You know the right answer?
Examine the map showing US population distribution.
A map titled U S Population by Square Mile in 2...
Questions


English, 25.08.2019 17:50
Mathematics, 25.08.2019 17:50
Mathematics, 25.08.2019 17:50

History, 25.08.2019 17:50
Mathematics, 25.08.2019 17:50


World Languages, 25.08.2019 17:50


