
Social Studies, 04.12.2020 21:50 gerkera88
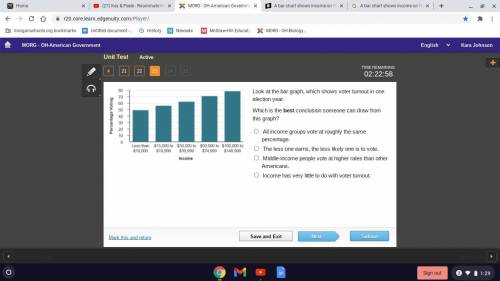
A bar chart shows income on the x axis and percentage voting on the y axis. Less than 10,000 dollars, 49. 15,000 to 19,999 dollars, 56. 30,000 to 39,999 dollars, 62. 50,000 to 74,999, 70. 100,000 to 149,999, 79.
Look at the bar graph, which shows voter turnout in one election year.
Which is the best conclusion someone can draw from this graph?
All income groups vote at roughly the same percentage.
The less one earns, the less likely one is to vote.
Middle-income people vote at higher rates than other Americans.
Income has very little to do with voter turnout.

Answers: 1


Another question on Social Studies
Social Studies, 22.06.2019 15:00
On which area of the map would you most likely find people belonging to the kurdish ethnic group? a) 1 b) 2 c) 3 d) 4 sroy no pic i could't do it
Answers: 3
Social Studies, 22.06.2019 19:00
To what is the growth of civilization most clearly traced
Answers: 1
Social Studies, 23.06.2019 08:00
Which of the following statements about culture and self-esteem is the most accurate? people from western cultures are more likely to say or do things to enhance other people's self-esteem (relative to people from asian cultures). the japanese praise each other for their achievements more often than americans do. people from asian cultures generally feel worse about themselves than people from western cultures. americans utter many more self-complimentary statements during conversations (relative to japanese individuals).
Answers: 1
Social Studies, 23.06.2019 13:30
While acknowledging that there are greater employment opportunities for latin american women in cities than in the countryside, social science theorists have continued to argue that urban migration has unequivocally hurt women's status. however, the effects of migration are more complex than these theorists presume. for example, effects can vary depending on women's fin?
Answers: 2
You know the right answer?
A bar chart shows income on the x axis and percentage voting on the y axis. Less than 10,000 dollars...
Questions
Social Studies, 08.06.2021 20:30

Mathematics, 08.06.2021 20:30

Physics, 08.06.2021 20:30
Mathematics, 08.06.2021 20:30

English, 08.06.2021 20:30
Mathematics, 08.06.2021 20:30
Mathematics, 08.06.2021 20:30
Mathematics, 08.06.2021 20:30
Mathematics, 08.06.2021 20:30
Mathematics, 08.06.2021 20:30
Mathematics, 08.06.2021 20:30
Mathematics, 08.06.2021 20:30


