
Social Studies, 16.12.2020 21:50 GTYT9972
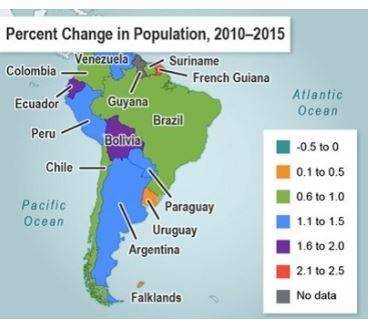
Examine the map showing population change in South America.
A map titled Percent Change in Population from 2010 to 2015 in South America. Countries are labeled, clockwise, Venezuela, Guyana, Suriname, French Guiana, Brazil, Paraguay, Uruguay, Argentina, Falklands, Chile, Bolivia, Peru, Ecuador, and Colombia. A key notes percentage of change. Colombia Brazil, Suriname, and Chile are 0.6 to 1.0 percent. Argentina, Paraguay, Peru, and Venezuela are 1.1 to 1.5 percent. Ecuador and Bolivia are 1.6 to 2.0 percent. Uruguay is 0.1 to 0.5 percent. French Guiana is 2.1 to 2.5 percent.
Which conclusion regarding the populations of South American countries from 2010 to 2015 can be drawn from the map?
Argentina’s population grew at a faster rate than did Peru’s population.
Uruguay was the only country in South America to see a decrease in population.
French Guiana experienced the fastest increase in population of all the countries in South America.
Brazil, Chile, Colombia, and Suriname had the lowest rates of population growth of all South American countries.

Answers: 2


Another question on Social Studies
Social Studies, 23.06.2019 00:00
Transcendentalist walt whitman captured the spirit of young america by creating
Answers: 1
Social Studies, 23.06.2019 07:30
Which statements are true about "evidence"? )observations which answer questions )proof that an idea is true )information for or against an idea )data to draw a conclusion
Answers: 2
Social Studies, 23.06.2019 09:00
The seven weeks’ war between austria and prussia italy add the province of to the kingdom of italy.
Answers: 1
You know the right answer?
Examine the map showing population change in South America.
A map titled Percent Change in Populati...
Questions

Mathematics, 25.07.2019 11:30
Mathematics, 25.07.2019 11:30
Mathematics, 25.07.2019 11:30
Mathematics, 25.07.2019 11:30
Mathematics, 25.07.2019 11:30
Mathematics, 25.07.2019 11:30
Mathematics, 25.07.2019 11:30
Mathematics, 25.07.2019 11:30
Social Studies, 25.07.2019 11:30


