Social Studies, 19.12.2020 01:00 hannahbear16841
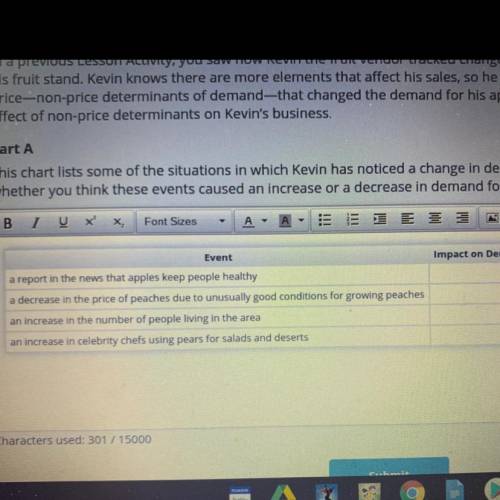
Part A
This chart lists some of the situations in which Kevin has noticed a change in demand. Complete the chart by indicating
whether you think these events caused an increase or a decrease in demand for his apples.
Part B. This graph shows how the demand for apples changed following positive news reports about the nutritional value of apples. Curve AB shows the demand before the news reports while curve XY illustrates the demand after the news reports. Study the graph, and describe how the demand curve moved.


Answers: 1


Another question on Social Studies

Social Studies, 22.06.2019 09:00
What are objects called that have value in and of themselves as well as value as a means of exchange? custom commodity money currency simple money
Answers: 1

Social Studies, 22.06.2019 23:30
Astudent receives a pell grant based on the_.a.satb.nasac.fafsad.act
Answers: 1

Social Studies, 23.06.2019 19:50
Which of the following statements about transportation cost is ture
Answers: 2

Social Studies, 23.06.2019 22:30
The united states highway system is a what in the united states numbered within a national grid
Answers: 1
You know the right answer?
Part A
This chart lists some of the situations in which Kevin has noticed a change in demand. Compl...
Questions


History, 22.06.2019 14:30


Social Studies, 22.06.2019 14:30


Physics, 22.06.2019 14:30

Biology, 22.06.2019 14:30


