
Social Studies, 06.03.2021 20:20 blakeolson0800
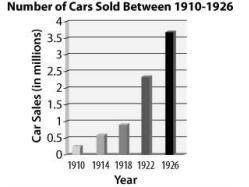
The graph below shows the number of cars purchased in selected years between 1910 and 1926.
Which was MOST LIKELY to have been an incentive for the trend seen in the graph?
A. The price of cars decreased during this period.
B. The later cars were made out of more expensive materials
C. Restrictions were placed on the type of fuel cars used.
D. The government restricted the number of cars that could be produced in a given year

Answers: 1


Another question on Social Studies
Social Studies, 22.06.2019 10:10
Speaker 1: now that we are independent, americans should create a government that mirrors the government of great britain. speaker 2: after experiencing a tyranny of great britain, americans know how important it is to limit the government's power. speaker 3: our victory in the revolutionary war prove that americans have wisdom to choose good leaders. speaker 4: as for former colonies, the american states are likely to thrive under a system of strong centralized government. which speaker would most likely support the government established by the articles of confederation? a. speaker 2 b. speaker 3 c. speaker 1 d. speaker 4
Answers: 1
Social Studies, 23.06.2019 21:00
This is for my social studies guide and i can answer 21/22 of it perfectly fine. but can someone tell me what the caste system was, and what divisions/classes that it was apart of it?
Answers: 1
Social Studies, 23.06.2019 21:00
Fictional characters behave according to the same psychological probabilities as real people. but the characters of fiction are found in exotic dilemmas that real people hardly encounter. consequently, fiction provides us with the opportunity to ponder how people react in uncommon situations, and to deduce moral lessons, psychological principles, and philosophical insights from their behavior.
Answers: 2
You know the right answer?
The graph below shows the number of cars purchased in selected years between 1910 and 1926.
Which w...
Questions

Mathematics, 25.01.2022 01:10
Mathematics, 25.01.2022 01:10


Chemistry, 25.01.2022 01:10
Mathematics, 25.01.2022 01:10
Mathematics, 25.01.2022 01:10
Social Studies, 25.01.2022 01:10

Mathematics, 25.01.2022 01:10
English, 25.01.2022 01:10
Mathematics, 25.01.2022 01:10
Chemistry, 25.01.2022 01:10

Geography, 25.01.2022 01:10

Mathematics, 25.01.2022 01:10
Physics, 25.01.2022 01:10


