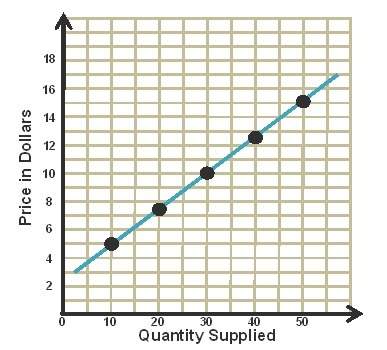
The graph shows the market for graphic t-shirts.
what does the graph show about the rela...

Social Studies, 20.12.2019 19:31 Inktown4life0
The graph shows the market for graphic t-shirts.
what does the graph show about the relationship between a product and its price?
as the amount of a product goes up, the price goes up.
as the amount of a product goes down, the price goes up.
as the interest in a product goes up, the price goes up.
as the interest in a product goes down, the price goes up.


Answers: 1


Another question on Social Studies

Social Studies, 22.06.2019 13:30
What city was divided between communism and democracy/capitalism after world war 2
Answers: 1

Social Studies, 23.06.2019 02:00
The graph represents price and output quantities under a monopoly what price will the monopolist firm set
Answers: 2

Social Studies, 23.06.2019 10:50
Francine, a college freshman, has agreed to participate in a psychology research study. before she begins her participation, she reads a statement written by the researcher explaining the purpose of the research and the potential risks of participation. it also explains that francine is free to withdraw from the research at any time. in providing francine with this statement, the researcher has followed the ethical guidelines of for participants.
Answers: 2

Social Studies, 23.06.2019 15:30
Answer quickly! first to answer will get brainliest and 5 star ! the brunswick shipyards had the biggest economic impact in which area during world war ii? a) 1 b) 2 c) 3 d) 4
Answers: 2
You know the right answer?
Questions


Chemistry, 01.08.2019 09:00


Computers and Technology, 01.08.2019 09:00

Biology, 01.08.2019 09:00


Chemistry, 01.08.2019 09:00

Chemistry, 01.08.2019 09:00


