
Social Studies, 11.12.2021 01:00 smith5845
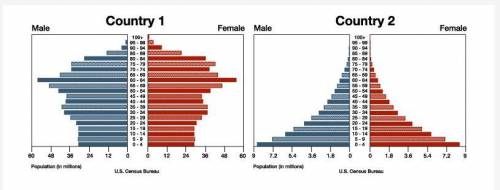
The population pyramids above show two countries with differing rates of population growth.
A. Compare the growth characteristics of Country 1 and Country 2.
B. Explain how EACH country's population growth relates to the Demographic Transition Model.
C. Identify and explain ONE potential advantage associated with the population structure of each country.
D. Identify and explain ONE potential disadvantage associated with the population structure of each country.
E. Explain what information about populations cannot be gathered when looking solely at population pyramid data.

Answers: 3


Another question on Social Studies
Social Studies, 21.06.2019 20:30
What is the best explanation as to the dividing line between french and british claims in north america at this time?
Answers: 2
Social Studies, 22.06.2019 01:00
Which of the following best completes the diagram above? a. land ordinance b. northwest ordinance c. revolutionary war d. shays' rebellion
Answers: 1
Social Studies, 22.06.2019 12:30
What does a most-favored-nation (mfn) status mean? a country pays the same tariffs as those paid by all mfn countries. a country has a special exemption from all tariffs in the united states. a country has special licensing agreements with u.s. corporations. a country is exempt from product standards that make it expensive for goods to be imported.
Answers: 3
Social Studies, 22.06.2019 20:00
The document asks about dependents because the number can affect who pays taxes. increase overall taxes. lower overall taxes. affect when to pay taxes.
Answers: 2
You know the right answer?
The population pyramids above show two countries with differing rates of population growth.
A. Com...
Questions


English, 23.06.2019 00:00

Business, 23.06.2019 00:00

Mathematics, 23.06.2019 00:00
Business, 23.06.2019 00:00

Chemistry, 23.06.2019 00:00
History, 23.06.2019 00:00

Computers and Technology, 23.06.2019 00:00

Social Studies, 23.06.2019 00:00
Chemistry, 23.06.2019 00:00


