Social Studies, 22.01.2022 03:20 jessicap7pg75
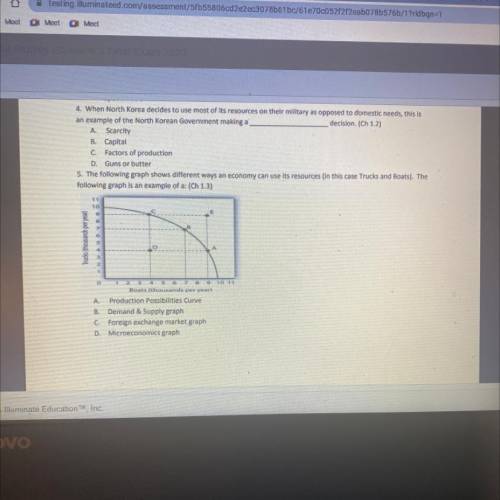
5. The following graph shows different ways an economy can use its resources (in this case Trucks and Boats). The
following graph is an example of a:
A. Production Possibilities Curve
В. Demand & Supply graph
C. Foreign exchange market graph
D. Microeconomics graph


Answers: 2


Another question on Social Studies

Social Studies, 22.06.2019 09:50
What was the main purpose of one of the first world organizations
Answers: 3

Social Studies, 22.06.2019 19:00
Which of these was not a component of the american system? a) protective tariff b) internal improvements c) universal manhood suffrage eliminate d) the 2nd bank of the united states
Answers: 1

Social Studies, 23.06.2019 02:30
to say that impression management is collaborative means that
Answers: 1

You know the right answer?
5. The following graph shows different ways an economy can use its resources (in this case Trucks an...
Questions

Chemistry, 01.12.2020 23:30


English, 01.12.2020 23:30

Mathematics, 01.12.2020 23:30


Health, 01.12.2020 23:30

Computers and Technology, 01.12.2020 23:30

History, 01.12.2020 23:30


Biology, 01.12.2020 23:30


Mathematics, 01.12.2020 23:30

Mathematics, 01.12.2020 23:30

Mathematics, 01.12.2020 23:30

Mathematics, 01.12.2020 23:30

Computers and Technology, 01.12.2020 23:30


English, 01.12.2020 23:30


