
Biology, 23.04.2020 19:30 kierraware04
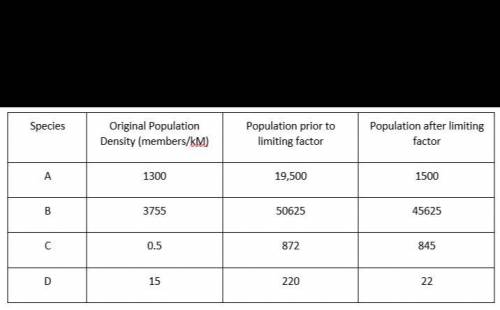
The chart shows data collected by ecologist detailing the size of populations prior to and after a limiting factor affected the population size of a species. Which species were impacted by a density dependent limiting factor? *
A) D only
B) A, B, D
C) C only
D) A, B, C

Answers: 3


Another question on Biology
Biology, 22.06.2019 11:30
About how many years does it take for one cycle of surface water to become deep water and then surface water again in the oceans? 101001,000
Answers: 1
Biology, 22.06.2019 13:00
Which of the following cell structures is significantly different between gram- positive and gram-negative bacteria?
Answers: 3
Biology, 22.06.2019 14:30
Find the mass of the cone using the triple beam balance. a. 543.0 g b. 542.0 g c. 504.28 g d. 502.8 g select the best answer from the choices provided a b c d
Answers: 3
Biology, 22.06.2019 22:30
Based on their relative positions in the periodic table, which two elements would have the same number of valence electrons?
Answers: 3
You know the right answer?
The chart shows data collected by ecologist detailing the size of populations prior to and after a l...
Questions

History, 02.08.2019 17:30
Biology, 02.08.2019 17:30


Physics, 02.08.2019 17:30
Mathematics, 02.08.2019 17:30
Mathematics, 02.08.2019 17:30
Mathematics, 02.08.2019 17:30

Computers and Technology, 02.08.2019 17:30


Arts, 02.08.2019 17:30
Mathematics, 02.08.2019 17:30


