The graph shows how the rate of photosynthesis in a green plant changes with light intensity
at...

Biology, 06.05.2020 12:58 natnerd4671
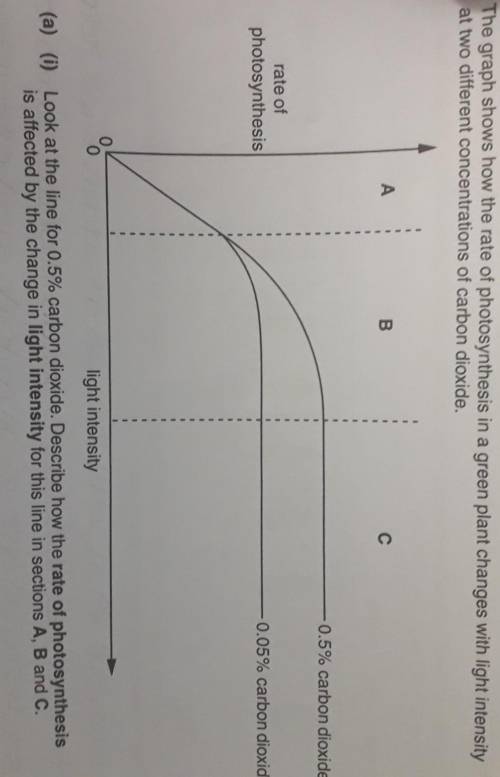
The graph shows how the rate of photosynthesis in a green plant changes with light intensity
at two different concentrations of carbon dioxide.
0
-0.5% carbon dioxide
rate of
photosynthesis
0.05% carbon dioxide
(a) (i)
light intensity
Look at the line for 0.5% carbon dioxide. Describe how the rate of photosynthesis
is affected by the change in light intensity for this line in sections A, B and C.
A:
B:
C:

Answers: 2


Another question on Biology
Biology, 22.06.2019 05:00
This comparative chart is an example of one that might be used by scientists and law enforcement personnel for identification purposes. the chart represents a technological advance called
Answers: 2
Biology, 22.06.2019 08:20
Which is not a characteristic of bacteria? a. they are unicellular. b. they are prokaryotic. c. they are the smallest form of life on earth. d. they are multicellular.
Answers: 2
Biology, 22.06.2019 22:30
Which organs of the urinary system allow you to consciously control when urination will occur? a. kidneys and the urethra b. kidneys and the ureters c. bladder and the urethra d. bladder and the ureters
Answers: 2
You know the right answer?
Questions


Biology, 31.03.2020 01:24

Medicine, 31.03.2020 01:24


Chemistry, 31.03.2020 01:25

Mathematics, 31.03.2020 01:25
Mathematics, 31.03.2020 01:25
Mathematics, 31.03.2020 01:25
Mathematics, 31.03.2020 01:25
Biology, 31.03.2020 01:25


