
Business, 12.10.2020 17:01 yuki430p7szcq
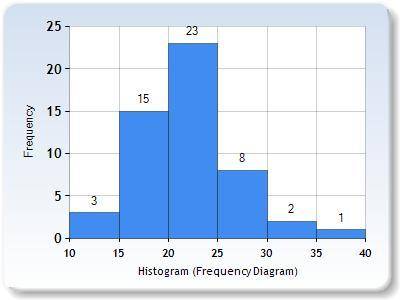
Suppose Procter & Gamble sells about 20 million bars of soap per week, but the demand is not constant and production management would like to get a better handle on how sales are distributed over the year. Let the following sales figures given in units of million bars represent the sales of bars per week over 1 year (in no particular order).
17.1 22.3 17 25.2 19.6 12.2 18.3 26.3 15.4 19.9 13.6 23.9 17.4 21.5 39.8 30.6 15 20.4 20.7 25.2 18.5 20.3 21.3 26.2 20.6 15.5 22.5 26.9 18.4 23.6 21.4 32.8 20 19.1 23.4 26.3 20.9 20.4 23.1 26.6 19.3 15.4 22.8 24.3 18.2 20.3 21.4 26.2 14.7 24.4 24 23.8
Required:
a. Construct a histogram chart to represent the data.
b. Creating a chart is not useful in and of itself unless it is properly interpreted. Write a brief analysis of the graph. What do you see in the graph that might be helpful to the production and sales people?

Answers: 1


Another question on Business
Business, 21.06.2019 17:10
Titus manufacturing, inc. provided the following information for the year: purchases - direct materials $91,000 plant utilities and insurance 68,000 indirect materials 11,170 indirect labor 4270 direct materials used in production 99,000 direct labor 117,500 depreciation on factory plant & equipment 4000the inventory account balances as of january 1 are given below. direct materials $44,000 work-in-progress inventory 10,000 finished goods inventory 50,000what is the ending balance in the direct materials account? $135,000 $36,000 $110,170 $6000
Answers: 3
Business, 22.06.2019 11:40
Select the correct answer brian wants to add a chart to his dtp project. what is the best way he can do this? a draw the chart using the dtp program draw option b create the chart in a spreadsheet then import it c. use the dtp chart wizard to create the chart within the dtp d. create an image of the chart in an image editor then import the image e use html code to create a chart within the dtp program
Answers: 3
Business, 22.06.2019 12:20
In terms of precent, beer has more alcohol than whiskey true or false
Answers: 1
Business, 22.06.2019 16:50
Identify and describe a variety of performance rating scales that can be used in organizations including graphical scales, letter scales, and numeric scales.
Answers: 2
You know the right answer?
Suppose Procter & Gamble sells about 20 million bars of soap per week, but the demand is not con...
Questions


Medicine, 19.07.2019 02:20
Engineering, 19.07.2019 02:20

Computers and Technology, 19.07.2019 02:20
Computers and Technology, 19.07.2019 02:20
Computers and Technology, 19.07.2019 02:20
Medicine, 19.07.2019 02:20
Medicine, 19.07.2019 02:20
Engineering, 19.07.2019 02:20


