
Chemistry, 28.02.2020 19:51 laurabwhiddon
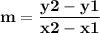
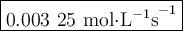
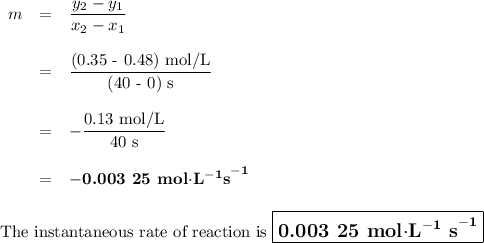
Time and concentration data were collected for the reaction A ⟶ products t (s) [A] (M) 0 0.52 20 0.43 40 0.34857 60 0.28538 80 0.23365 100 0.19130 The blue curve is the plot of the data. The straight orange line is tangent to the blue curve at t = 40 s. A plot has the concentration of A in molar on the y axis and time in seconds on the x axis. A curve contains the points (0, 0.52), (20, 0.43), (40, 0.35), (60, 0.29), (80, 0.24), and (100, 0.20). A line touches the curve at (40, 0.35) and has a y intercept of (0, 0.48). Approximate the instantaneous rate of this reaction at time t = 40 s.

Answers: 1

![Time and concentration data were collected for the reaction A ⟶ products t (s) [A] (M) 0 0.52 20 0.4](/tpl/images/0528/3101/b8cca.jpg)
![\begin{array}{rc}\textbf{t/s} & \textbf{[A]/mol$\cdot$L}^{\mathbf{-1}} \\0 & 0.52 \\20 & 0.43 \\40 & 0.35 \\60 & 0.29 \\80 & 0.24 \\100 & 0.20 \\\end{array}](/tpl/images/0528/3101/74b9f.png)


Another question on Chemistry
Chemistry, 22.06.2019 14:00
How does the presence of oxygen affect the chemical pathways used to extract energy from glucose?
Answers: 3
Chemistry, 22.06.2019 14:30
Which of the following describes a situation where competition between producers exists
Answers: 1
You know the right answer?
Time and concentration data were collected for the reaction A ⟶ products t (s) [A] (M) 0 0.52 20 0.4...
Questions


Mathematics, 13.07.2020 19:01
Mathematics, 13.07.2020 19:01

Mathematics, 13.07.2020 19:01
Mathematics, 13.07.2020 19:01
Physics, 13.07.2020 19:01


