
Image courtesy of NASA Earth Observatory
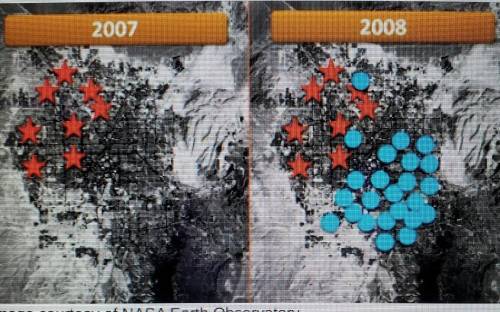
The map above shows an example of how we can combine maps and data using GIS. The background is a satellite map of
a city. The red stars show grocery stores open in the city, and the blue circles show where new convenience stores have
opened.
Based on the information on the map above, what conclusion can you come to about these grocery stores?
A. More stores opened in 2008, and they opened in a different area.
B. Many stores opened in 2007, but none opened in 2008.
C. The same number of stores opened during both years.
D. Nothing changed between 2007 and 2008.

Answers: 1


Another question on Geography
Geography, 23.06.2019 19:00
Why is the huronian supergroup rock formation particularly interesting to scientists? because it looks like a cross-section of a giant, stone encyclopedia because it formed during the period when oxygen began to accumulate in the atmosphere because it contains unusually large amounts of oxygen and sulfur because it dramatically altered the planet's development when it first formed
Answers: 2
You know the right answer?
Image courtesy of NASA Earth Observatory
The map above shows an example of how we can combine maps...
Questions


