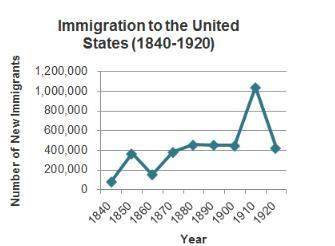
The chart shows immigration to the united states between 1840 and 1920.
(picture)
<...

History, 02.12.2019 08:31 Monicaamm12983
The chart shows immigration to the united states between 1840 and 1920.
(picture)
which conclusion does the chart support?
america experienced a major population increase and did not want to disrupt its ethnic diversity by going to war.
america experienced a major population decrease and could not afford to get involved in a war overseas.
america experienced a major population increase and did not want to disrupt this growth by going to war.
america experienced a major population decrease in 1910 and could not afford to lose more people in a war overseas.

Answers: 1


Another question on History
History, 21.06.2019 20:40
Why was the land in the middle colonies attractive to immigrants
Answers: 1
History, 21.06.2019 23:00
Which of the following best describes nativism? a group’s shared beliefs, values, and ways of life the belief that the interests of native citizens should come before the interests of outsiders the act of separating one group from another group a distinct group that lives or works together within a larger community
Answers: 2
History, 22.06.2019 07:00
During the 1920s, many people looked for ways to maintain traditional social order as the nation rapidly moved into a new, modern era. which groups or types would most likely be in this category?
Answers: 2
History, 22.06.2019 10:30
Which statement about congress is accurate? it contains only the house of representatives. the senate’s membership is based on a state’s population. it is bicameral, according to the constitution. membership in both houses is based on equal representation.
Answers: 1
You know the right answer?
Questions


Mathematics, 26.03.2020 16:51
English, 26.03.2020 16:51


