
Mathematics, 07.07.2019 04:30 sannai0415
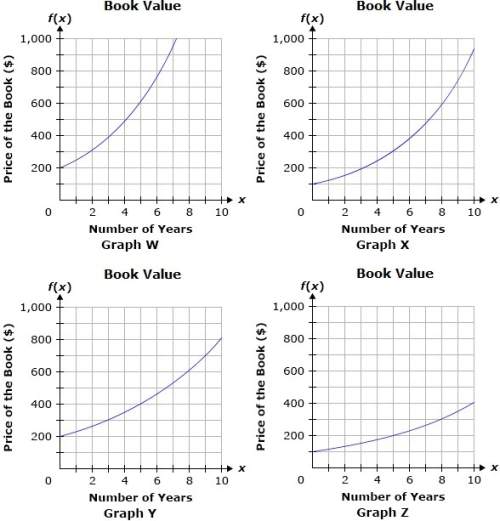
Arare first-edition book is currently priced at $200. after one year, the price of the book is anticipated to be 1.15 times the current price of the book. then, one year after that, the price of the book is anticipated to be 1.15 times the price of the book the previous year. if this pattern continues, which of the following graphs represents the price of the book over time? a. graph w b. graph x c. graph y d. graph x

Answers: 2


Another question on Mathematics
Mathematics, 22.06.2019 03:00
The triangle rst, rs = 65 and st = 60. which equation could be used to find the value of angle s?
Answers: 1
You know the right answer?
Arare first-edition book is currently priced at $200. after one year, the price of the book is antic...
Questions

Biology, 13.09.2019 00:10


