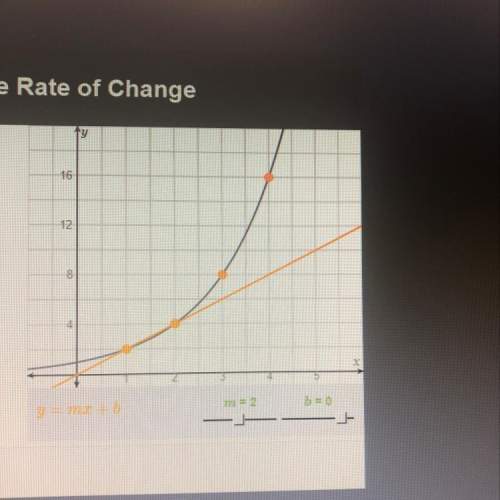
The average rate of change between x = 1 to x = 2 is 2, from x = 2 to x = 3 is 4 and from x = 3 to x = 4 is 8.
Step-by-step explanation: We are given to find the rate of change from
x = 1 to x = 2, x = 2 to x = 3 and x = 3 to x = 4.
We know that
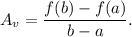
The average rate of change between x = a to x = b for a function f(x) is given by
For the given function f(x), we have from the graph that
f(1) = 2, f(2) = 4, f(3) = 8 and f(4) = 16.
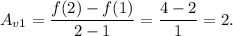
So, the average rate of change from x = 1 to x = 2 is given by
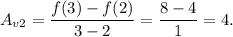
The average rate of change from x = 2 to x = 3 is given by
The average rate of change from x = 3 to x = 4 is given by

Thus, the average rate of change between x = 1 to x = 2 is 2, from x = 2 to x = 3 is 4 and from x = 3 to x = 4 is 8.