Mathematics, 29.01.2020 02:56 grayammip095l9
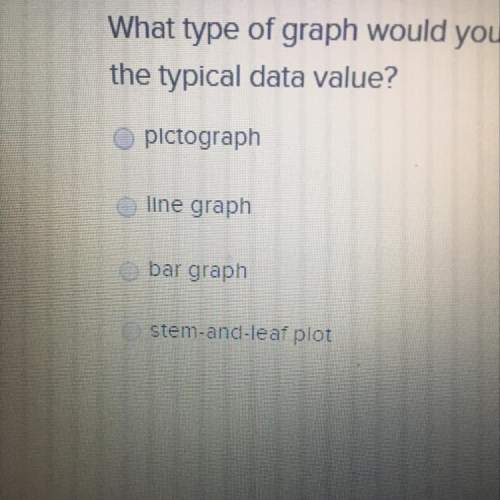
What type of graph would you use for a set of numerical data with a range of 90, from 5 to 95, where you wanted to find the typical data value?


Answers: 3


Another question on Mathematics

Mathematics, 21.06.2019 19:10
Aline that intersects one of two parallel lines intersects the other also always sometimes never
Answers: 3

Mathematics, 21.06.2019 20:00
For what type of equity loan are you lent a lump sum, which is to be paid within a certain period of time? a. a line of credit b. equity c. a second mortgage d. an amortization
Answers: 3

Mathematics, 22.06.2019 02:30
Acable company claims that the average household pays $78 a month for a basic cable plan, but it could differ by as much as $20. write an absolute value inequality to determine the range of basic cable plan costs with this cable company. a. |x − 78| ≥ 20 b. |x − 20| ≥ 78 c. |x − 20| ≤ 78 d. |x − 78| ≤ 20
Answers: 1

Mathematics, 22.06.2019 03:30
Carla is saving money for a trip this summer. she already has some money in her savings account and will add the same amount to her account each week. at the end of 2? weeks, carla has? $130. at the end of 8? weeks, she has? $280. write a linear function in the form y=mx+b to represent the amount of money m that carla has saved after w weeks.
Answers: 3
You know the right answer?
What type of graph would you use for a set of numerical data with a range of 90, from 5 to 95, where...
Questions


Mathematics, 09.11.2019 20:31

Chemistry, 09.11.2019 20:31


Mathematics, 09.11.2019 20:31

Social Studies, 09.11.2019 20:31

Mathematics, 09.11.2019 20:31

Mathematics, 09.11.2019 20:31

Geography, 09.11.2019 20:31


Social Studies, 09.11.2019 20:31


Mathematics, 09.11.2019 20:31


History, 09.11.2019 20:31


