
Mathematics, 30.01.2020 01:55 vvvvvvvv84
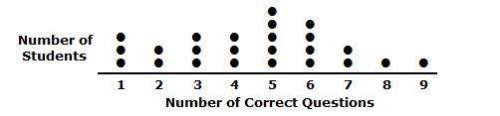
Mrs. montoro's class is participating in the math olympics. each week of the quarter, a challenging math question is posted, and the students individually try to correctly answer the question. the results of the math olympics are shown in the dot plot below.
which of the following statements describe the distribution in the dot plot?
(choose all that is correct)
1. the mean is 5 questions answered correctly
2. most students answered between 3 and 6 questions correctly
3. the median is 5 questions answered correctly
4. the median is 4.5 questions answered correctly
5. most students answered between 5 and 7 questions correctly
6. the mean is 4.5 questions answered correctly
7. the students answered between 1 and 9 questions correctly

Answers: 3


Another question on Mathematics
Mathematics, 20.06.2019 18:02
99 points at a zoo, the leopard pen has a ring-shaped sidewalk around it. the outer edge of the sidewalk is a circle with a radius of 12 m. the inner edge of the sidewalk is a circle with a radius of 8 m. (1 point for showing all of your work) a. write and simplify an expression for the exact area of the sidewalk. (1 point for the answer) b. find the approximate area of the sidewalk. use 3.14 to approximate π. (1 point for the answer)
Answers: 1
Mathematics, 21.06.2019 19:50
If the scale factor between two circles is 2x/5y what is the ratio of their areas?
Answers: 3
Mathematics, 21.06.2019 21:30
Hannah paid $3.20 for 16 ounces of potato chips. hank paid $3.23 for 17 ounces of potato chips. who paid less per ounces?
Answers: 1
Mathematics, 22.06.2019 01:20
1. why is a frequency distribution useful? it allows researchers to see the "shape" of the data. it tells researchers how often the mean occurs in a set of data. it can visually identify the mean. it ignores outliers. 2. the is defined by its mean and standard deviation alone. normal distribution frequency distribution median distribution marginal distribution 3. approximately % of the data in a given sample falls within three standard deviations of the mean if it is normally distributed. 95 68 34 99 4. a data set is said to be if the mean of the data is greater than the median of the data. normally distributed frequency distributed right-skewed left-skewed
Answers: 2
You know the right answer?
Mrs. montoro's class is participating in the math olympics. each week of the quarter, a challenging...
Questions

Advanced Placement (AP), 14.11.2020 02:10
Mathematics, 14.11.2020 02:10

Biology, 14.11.2020 02:10


Computers and Technology, 14.11.2020 02:10

Geography, 14.11.2020 02:10

History, 14.11.2020 02:10
Mathematics, 14.11.2020 02:10

Social Studies, 14.11.2020 02:10

Mathematics, 14.11.2020 02:10

Health, 14.11.2020 02:10


