
Mathematics, 20.10.2019 08:00 kereshmeh
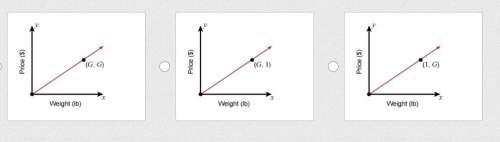
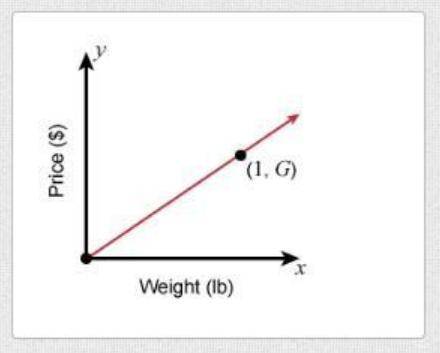
Which graph could represent the amount of green beans when selling at a unit rate of g dollars per pound?

Answers: 2


Another question on Mathematics
Mathematics, 21.06.2019 17:00
Need this asap if anyone can i would be very grateful. if you could show workings that would really
Answers: 1
Mathematics, 21.06.2019 17:30
Sheila wants to bake six muffins but the recipe is for 12 muffins . this means you only need half of the ingredients listed how much of the of each ingredient does she need? one cup and banana chips ,7 tablespoons oil , two eggs, 3/4 cups flour 1/4 cup walnuts show all you work and justify your answer using a baby toulmin.
Answers: 3
Mathematics, 21.06.2019 20:10
60 2(x + 2) in the diagram, gef and hef are congruent. what is the value of x?
Answers: 2
Mathematics, 21.06.2019 21:10
The table below shows the approximate height of an object x seconds after the object was dropped. the function h(x)= -16x^2 +100 models the data in the table. for which value of x would this model make it the least sense to use? a. -2.75 b. 0.25 c. 1.75 d. 2.25
Answers: 2
You know the right answer?
Which graph could represent the amount of green beans when selling at a unit rate of g dollars per p...
Questions


Computers and Technology, 11.10.2019 04:00


Geography, 11.10.2019 04:00
Mathematics, 11.10.2019 04:00

English, 11.10.2019 04:00

Mathematics, 11.10.2019 04:00
English, 11.10.2019 04:00

Health, 11.10.2019 04:00
Mathematics, 11.10.2019 04:00


