
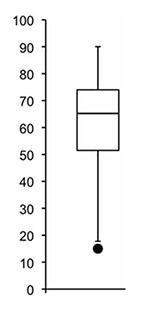
Which of the following is true of the data represented by the box plot?
a. the data is...

Mathematics, 23.10.2019 05:00 dondre54
Which of the following is true of the data represented by the box plot?
a. the data is skewed to the bottom and contains one outlier.
b. the data is skewed to the top.
c. the data has a symmetrical distribution and contains no outliers.
d. the mean is most likely greater than the median.

Answers: 3


Another question on Mathematics
Mathematics, 21.06.2019 22:00
Nikita wants to apply for student aid to fund her college education. arrange the steps involved in nikita’s application for financial aid
Answers: 3
Mathematics, 21.06.2019 23:50
Astudent draws two parabolas both parabolas cross the x axis at (-4,0) and (6,0) the y intercept of the first parabolas is (0,-12). the y intercept of the second parabola is (0,-24) what is the positive difference between the a values for the two functions that describe the parabolas
Answers: 3
Mathematics, 22.06.2019 00:30
Nellie is analyzing a quadratic function f(x) and a linear function g(x). will they intersect? f(x) g(x) graph of the function f of x equals one half times x squared, plus 2 x g(x) 1 5 2 10 3 15
Answers: 2
Mathematics, 22.06.2019 00:30
Officer brimberry wrote 32 tickets for traffic violations last week, but only 4 tickets this week. what is the percent decrease? give your answer to the nearest tenth of a percent.
Answers: 1
You know the right answer?
Questions


Computers and Technology, 19.09.2020 01:01
Mathematics, 19.09.2020 01:01
Mathematics, 19.09.2020 01:01


Biology, 19.09.2020 01:01


History, 19.09.2020 01:01


