The graph below shows the velocity f(t) of a runner during a certain time interval:
gra...

Mathematics, 16.11.2019 01:31 hana560
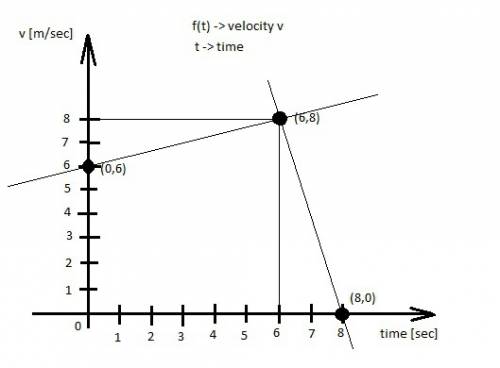
The graph below shows the velocity f(t) of a runner during a certain time interval:
graph of line segment going through ordered pairs 0, 6 and 6, 8. graph of another line segment going through the ordered pairs 6, 8 and 8, 0. label on the x axis is time in seconds and label on the y axis is velocity in meters per second
which of the following describes the intercepts on the graph?
the initial acceleration of the runner was 8 m/s2, and the runner stopped after 6 seconds.
the initial acceleration of the runner was 6 m/s2, and the runner stopped after 8 seconds.
the initial velocity of the runner was 8 m/s, and the runner stopped after 6 seconds.
the initial velocity of the runner was 6 m/s, and the runner stopped after 8 seconds.

Answers: 2


Another question on Mathematics
Mathematics, 21.06.2019 12:30
Convert 16 yards to feet use the conversion rate 3 feet = 1 yard
Answers: 2
Mathematics, 21.06.2019 21:30
Write an equation of the line that passes through the point (2, 3) and is perpendicular to the line x = -1. a) y = 1 b) y = 3 c) y = 0 eliminate d) y = -3
Answers: 1
Mathematics, 22.06.2019 00:00
Which of the following are arithmetic sequences? check all that apply. a. 0.3, 0.6, 0.9, 1.2, 1.5, b. 2, 3, 6, 11, 18, c. 150, 147, 144, 142, d. 2, 4, 9, 16, 25,
Answers: 1
You know the right answer?
Questions


Biology, 19.02.2020 23:17
Social Studies, 19.02.2020 23:17

Social Studies, 19.02.2020 23:17

Social Studies, 19.02.2020 23:17
Biology, 19.02.2020 23:17

Social Studies, 19.02.2020 23:18
Chemistry, 19.02.2020 23:18
English, 19.02.2020 23:18


