
Mathematics, 12.02.2020 18:21 leverso
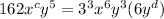
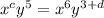
What values of c and d make the equation true? RootIndex 3 StartRoot 162 x Superscript c Baseline y Superscript 5 Baseline EndRoot = 3 x squared y (RootIndex 3 StartRoot 6 y Superscript d Baseline EndRoot) c = 2, d = 2 c = 2, d = 4 c = 6, d = 2 c = 6, d = 4

Answers: 1
![\sqrt[3]{162x^cy^5}=3x^2y \sqrt[3]{6y^d}](/tpl/images/0508/6252/1fb50.png)
![\left (\sqrt[3]{162x^cy^5}\right )^3=\left (3x^2y \sqrt[3]{6y^d}\right)^3](/tpl/images/0508/6252/9921d.png)
![162x^cy^5=\left (3x^2y \sqrt[3]{6y^d}\right)^3](/tpl/images/0508/6252/28118.png)


Another question on Mathematics
Mathematics, 21.06.2019 14:30
30 points and i will give brainliest the club will base its decision about whether to increase the budget for the indoor rock climbing facility on the analysis of its usage. the decision to increase the budget will depend on whether members are using the indoor facility at least two times a week. use the best measure of center for both data sets to determine whether the club should increase the budget. assume there are four weeks in a month. if you think the data is inconclusive, explain why.
Answers: 3
Mathematics, 21.06.2019 16:00
Part one: measurements 1. measure your own height and arm span (from finger-tip to finger-tip) in inches. you will likely need some from a parent, guardian, or sibling to get accurate measurements. record your measurements on the "data record" document. use the "data record" to you complete part two of this project. name relationship to student x height in inches y arm span in inches archie dad 72 72 ginelle mom 65 66 sarah sister 64 65 meleah sister 66 3/4 67 rachel sister 53 1/2 53 emily auntie 66 1/2 66 hannah myself 66 1/2 69 part two: representation of data with plots 1. using graphing software of your choice, create a scatter plot of your data. predict the line of best fit, and sketch it on your graph. part three: the line of best fit include your scatter plot and the answers to the following questions in your word processing document 1. 1. which variable did you plot on the x-axis, and which variable did you plot on the y-axis? explain why you assigned the variables in that way. 2. write the equation of the line of best fit using the slope-intercept formula $y = mx + b$. show all your work, including the points used to determine the slope and how the equation was determined. 3. what does the slope of the line represent within the context of your graph? what does the y-intercept represent? 5. use the line of best fit to you to describe the data correlation.
Answers: 2
Mathematics, 21.06.2019 17:00
Asailor is looking at a kite. if he is looking at the kite at an angle of elevation of 36and the distance from the boat to the point where the kite is directly overhead is 40 feet, how high is the kite?
Answers: 3
You know the right answer?
What values of c and d make the equation true? RootIndex 3 StartRoot 162 x Superscript c Baseline y...
Questions

Arts, 05.12.2020 20:20


Social Studies, 05.12.2020 20:20


Computers and Technology, 05.12.2020 20:20


English, 05.12.2020 20:20
Biology, 05.12.2020 20:20
Mathematics, 05.12.2020 20:20
Social Studies, 05.12.2020 20:20

History, 05.12.2020 20:20


