
Mathematics, 15.02.2020 01:22 Daniah2206
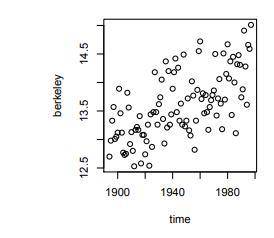
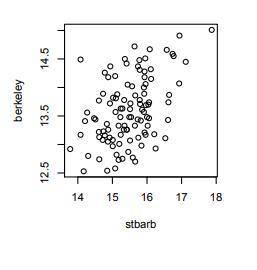
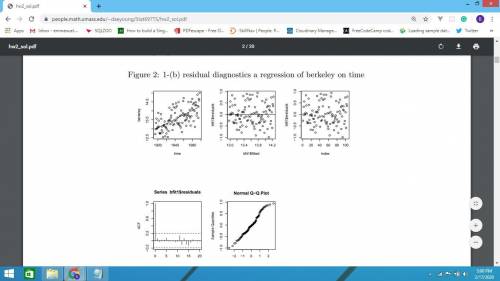
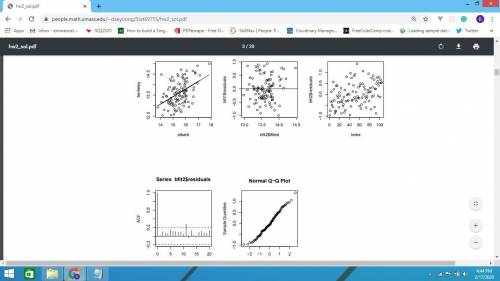
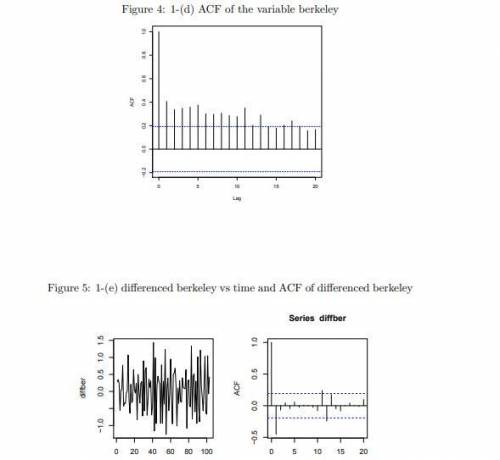
The file "berkeley. dat" contains average yearly temperatures for the cities of Berkeleyand Santa Barbara. Import the data into R using the following commandsberk<-scan("berkeley. dat", what=list(double(0),double(0),doubl e(0)))time<-berk[[1]]berkeley< ;-berk[[2]]stbarb<-berk[[3]](a) Plot the . Also, plotberkeleyversusstbarb.(b) Perform a regression ofberkeleyontime. What do you think about this fit? Besure to make diagnostic plots (including ACF) of the residuals. If there are anyviolations of the assumptions for a linear regression model, make sure to commenton them.(c) Perform a regression ofberkeleyonstbarb. Comment on the fit and the resid-uals.(d) Make a time series plot of the variableberkeleyand an ACF plot of the data. Does the time series appear to be stationary? Explain. Interpret the ACF plotin this situation.(e) Difference the data. The commanddiff(berkeley)will produce the differenceddata. Plot this differenced data, and make an ACF plot. What is your opinion ofwhether the series is stationary after differencing?(f) Now, we have detrended this series by using linear regression and with differenc-ing. The result of detrending via regression was a model that fit rather well andresiduals that had no apparent dependency. Let us assume then that the truemodel for this data isxt=β1+β2t+wt4
wherewt, t= 1, ..., Tis Gaussian white noise with varianceσ2w. (This is the sameas assuming that this data follows the standard regression assumptions.) Assum-ing this model, describe the model (i. e. write out a formula) for the differencedtime series,∇xt. Use this to explain the apparent dependency in the differenceddata from 1e above

Answers: 1


Another question on Mathematics
Mathematics, 21.06.2019 17:10
The random variable x is the number of occurrences of an event over an interval of ten minutes. it can be assumed that the probability of an occurrence is the same in any two-time periods of an equal length. it is known that the mean number of occurrences in ten minutes is 5.3. the appropriate probability distribution for the random variable
Answers: 2
Mathematics, 21.06.2019 18:00
Find the number of real number solutions for the equation. x2 + 5x + 7 = 0 0 cannot be determined 1 2
Answers: 2
Mathematics, 21.06.2019 18:20
Inez has a phone card. the graph shows the number of minutes that remain on her phone card a certain number of days.
Answers: 2
Mathematics, 22.06.2019 01:00
What is the slope of the line? a. -5/2 b.2/5 c. 5/2 d.7/2
Answers: 1
You know the right answer?
The file "berkeley. dat" contains average yearly temperatures for the cities of Berkeleyand Santa Ba...
Questions
Mathematics, 19.11.2019 16:31


Geography, 19.11.2019 16:31

Mathematics, 19.11.2019 16:31

Mathematics, 19.11.2019 16:31

Social Studies, 19.11.2019 16:31

History, 19.11.2019 16:31
Physics, 19.11.2019 16:31
Mathematics, 19.11.2019 16:31
English, 19.11.2019 16:31


