
Mathematics, 17.02.2020 22:20 saja19
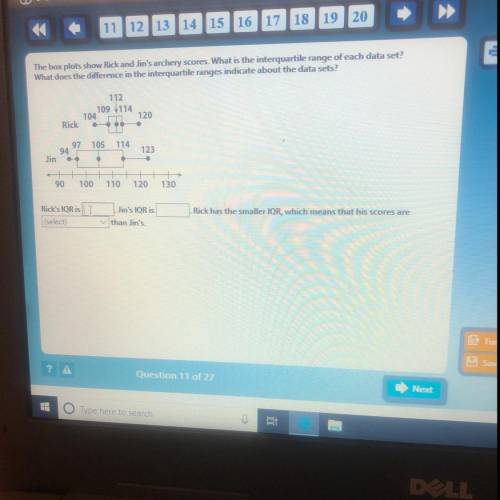
The box plots show Rick and Jin's archery scores. What is the interquartile range of each data set?
What does the difference in the interquartile ranges indicate about the data sets?
112
- 109 114
104
120
120
Ricka
97
105
114
123
]
Jin
90
100
110
120
130
Rick's IQR is
(select)
Jin's IQR is
than Jin's
Rick has the smaller IQR, which means that his scores are

Answers: 1


Another question on Mathematics
Mathematics, 21.06.2019 12:30
2men and 7 boys can do a piece of working 4 days.it is done by 4 men and 4 boys in 3 days how long would it take for 1man or one boy to do it alone
Answers: 3
Mathematics, 21.06.2019 19:30
Evaluate the expression for the given value of the variable. ∣-4b-8∣+∣-1-b^2 ∣+2b^3 ; b=-2
Answers: 2
Mathematics, 21.06.2019 20:00
1: 4 if the wew 35 surfboards at the beach how many were short boards?
Answers: 1
Mathematics, 22.06.2019 00:10
Of f(x) is byof f(x)=-3|x| x-.f(x)? a )f(x)=3|x| b) f(x)=|x+3| c) f(x)= -3|x| d) f(x)= -|x+3|
Answers: 2
You know the right answer?
The box plots show Rick and Jin's archery scores. What is the interquartile range of each data set?<...
Questions

Biology, 12.12.2020 16:30

Biology, 12.12.2020 16:30

Law, 12.12.2020 16:30

Social Studies, 12.12.2020 16:30
Mathematics, 12.12.2020 16:30
Engineering, 12.12.2020 16:30
Mathematics, 12.12.2020 16:30

Mathematics, 12.12.2020 16:30
Mathematics, 12.12.2020 16:30

Mathematics, 12.12.2020 16:30
Mathematics, 12.12.2020 16:30


