Referring to the figure, determine which of the following graphs
best depicts this situation:...

Mathematics, 20.02.2020 20:05 zhellyyyyy
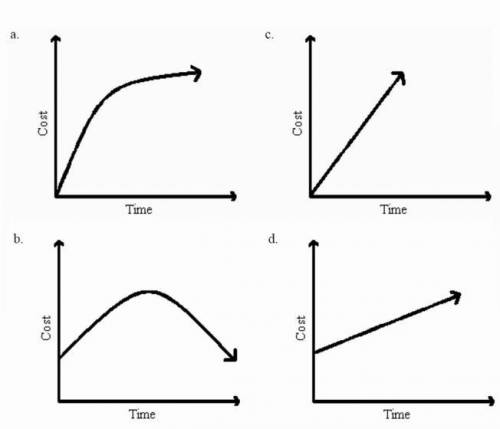
Referring to the figure, determine which of the following graphs
best depicts this situation: A vacuum repair shop charges a fixed
price plus a certain amount per half hour to repair a vacuum. Which
graph best shows how much a customer is charged based on how long the
job takes?
a. Graph a c. Graph c
b. Graph b d. Graph d

Answers: 3


Another question on Mathematics
Mathematics, 21.06.2019 12:30
How can you solve an equation with a variable on both sides? complete the explanation. you can solve the equation by using *(blank)* operations to get the variable terms on one side of the equal sign and the constant terms on the *(blank)* side. then *(blank)* both sides by the coefficient of the resulting variable term.
Answers: 2
Mathematics, 21.06.2019 19:30
The standard deviation for a set of data is 5.5. the mean is 265. what is the margin of error?
Answers: 3
Mathematics, 21.06.2019 23:00
Find the dimensions of the circle. area = 64π in.² r= in.
Answers: 1
Mathematics, 21.06.2019 23:20
Suppose a laboratory has a 30 g sample of polonium-210. the half-life of polonium-210 is about 138 days how many half-lives of polonium-210 occur in 1104 days? how much polonium is in the sample 1104 days later? 9; 0.06 g 8; 0.12 g 8; 2,070 g
Answers: 1
You know the right answer?
Questions

Biology, 06.10.2019 08:20
Mathematics, 06.10.2019 08:20


Physics, 06.10.2019 08:20


History, 06.10.2019 08:20

English, 06.10.2019 08:20
Mathematics, 06.10.2019 08:20
Mathematics, 06.10.2019 08:20
Mathematics, 06.10.2019 08:20

Social Studies, 06.10.2019 08:20
English, 06.10.2019 08:20
Mathematics, 06.10.2019 08:20
Biology, 06.10.2019 08:20


